
Fig. 1.
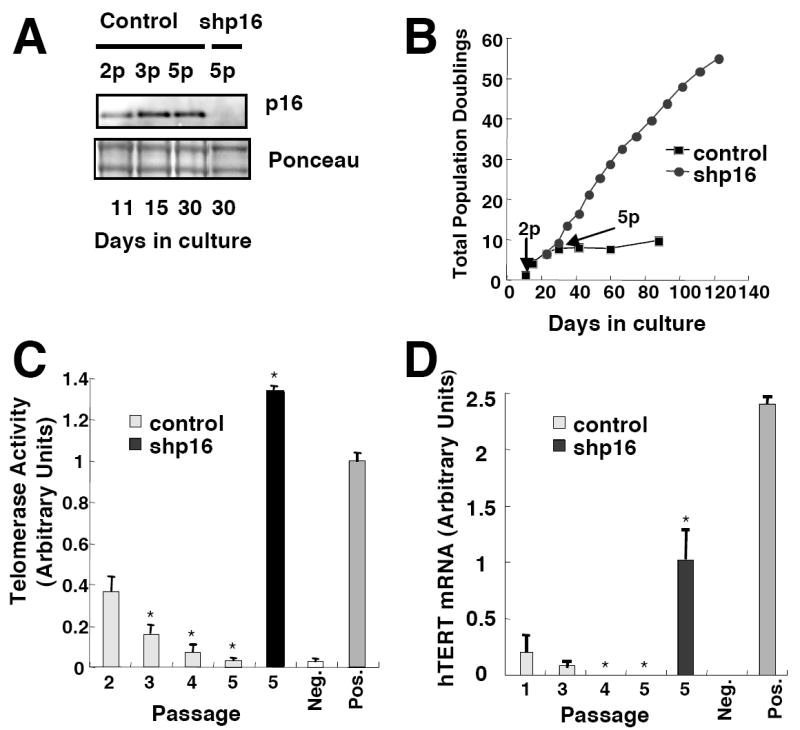
p16INK4a is responsible for telomerase repression in proliferating HMEC. (A) Control and corresponding cultures expressing p16shRNA were harvested at indicated passages (p). Total p16 levels were determined by immunoblotting. (B) Total population doublings of control HMEC or HMEC expressing shp16 are plotted versus time. Results shown are representative of 4 non-malignant specimens. (C) Telomerase activity was assayed at indicated passages. Mean values and SD (n=3) are representative of two non-malignant specimens. Values significantly different from telomerase activity at passage 2 (p < 0.05, Student’s t-test) are denoted with a *. (D) hTERT mRNA levels were assayed at indicated passages by Taqman PCR. Mean values and SD (n=6) are representative of two non-malignant specimens and presented relative to each other after normalization using mRNA levels of TATA binding protein (TBP). Values significantly different from hTERT mRNA levels at passage 1 (p < 0.05, Student’s t-test) are denoted with a *. Values obtained for normal human fibroblasts (WI38) and malignant human breast cancer cells (MCF7) are presented as negative and positive controls.