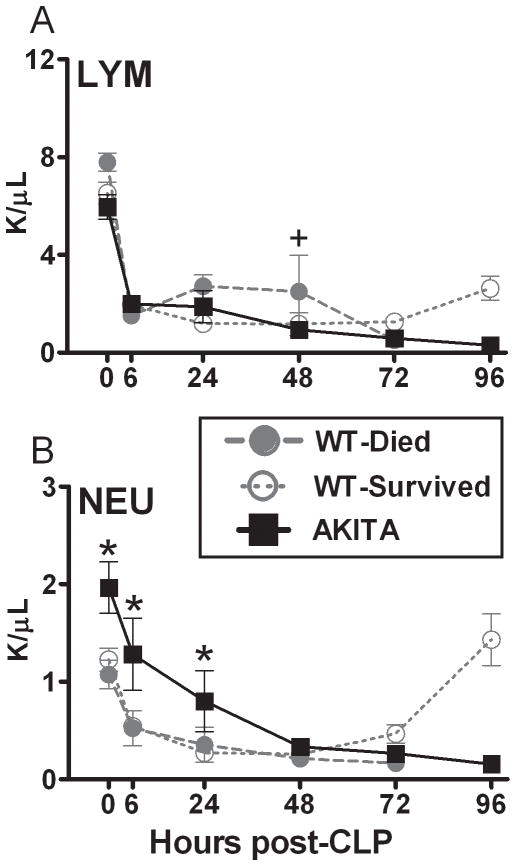
FIG. 3. Temporal profiles of lymphocytes (LYM; panel A) and neutrophils (NEU; panel B) in diabetic (AKITA) and non-diabetic wild type (WT) mice in the acute phase (days 1–5) of sepsis.
Non-diabetic animals were additionally divided into two groups based on outcome: WT-Died (dead within days 1–5) and WT-Survived (alive after day 5). All parameters were measured (counts per μl blood) at 24h intervals post-CLP (see statistical section for distribution of n). Data are mean ± SEM. + P < 0.05 between WT-Died and remaining groups; # P < 0.05 between AKITA and WT-Survived by one sample Wilcoxon Signed Rank Test.; * P < 0.05 between AKITA and WT mice.

