
Fig. 1.
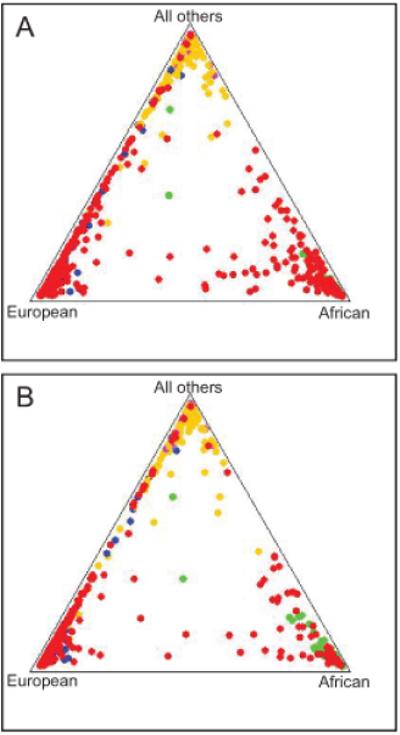
Stratification of the populations by ethnic affiliation. Alu genotypes and Structure analysis were employed to assign subjects to two major strata, European and African, in the Georgia (A) and Louisiana (B) populations. The Structure analysis was carried out in two batches for Louisiana consisting of 434 and 435 samples to speed computation, the latter of which is shown, while all 650 samples from Georgia were analyzed in one batch. Dots: red (Georgia or Louisiana samples), green (African control samples), blue (European control samples), pink (Asian control samples), orange (Indian control samples). Indian refers to the Indian subcontinent. Not all samples are evident due to superposition of dots.