
Fig. 3.
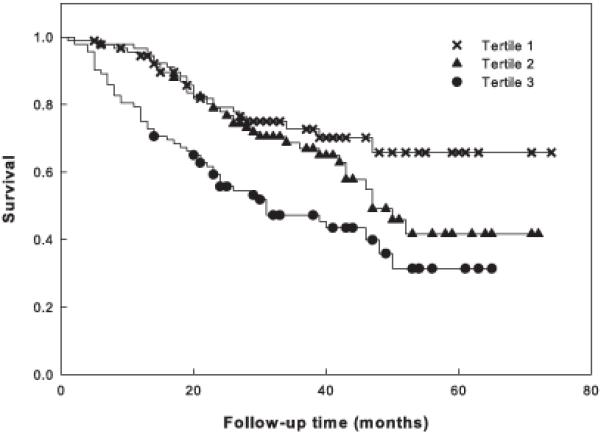
Survival of nonagenarians as a function of their healthy aging profile. Kaplan-Meier survival of all nonagenarians in the Louisiana sample is plotted after partitioning individuals into tertiles of deficit accumulation. Deficit count increases from tertile 1 to 3. Mortality was assessed on follow up after enrollment. Censoring is indicated by the symbols.