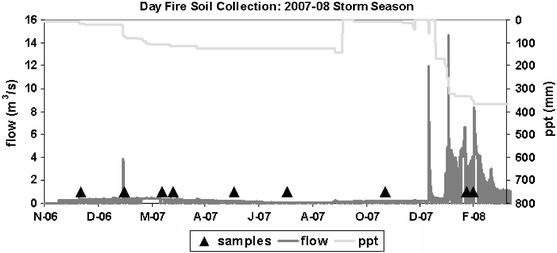
Fig. 2.

Day Fire (Piru Creek Watershed) sampling collection for designated seasons (November 2006–February 2008). Collection dates (triangles) are shown relative to timing of storm events, with streamflow shown on the left y-axis (cubic meter per second) and precipitation shown on the right y-axis (millimeter)
