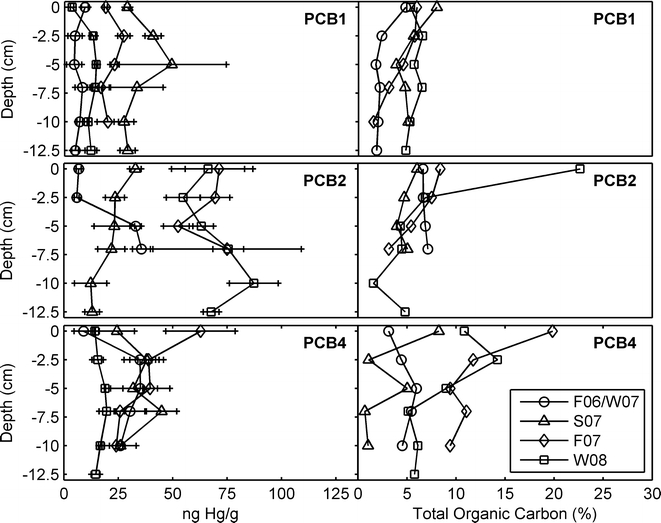
Fig. 5.

Hg concentration profiles (left) and TOC profiles (right) of the Piru Creek burned sites: PCB1 (top row), PCB2 (middle row), and PCB4 (bottom row). A circle, triangle, diamond, and square are used to represent F06/W07, S07, F07, and W08 sampling dates, respectively
