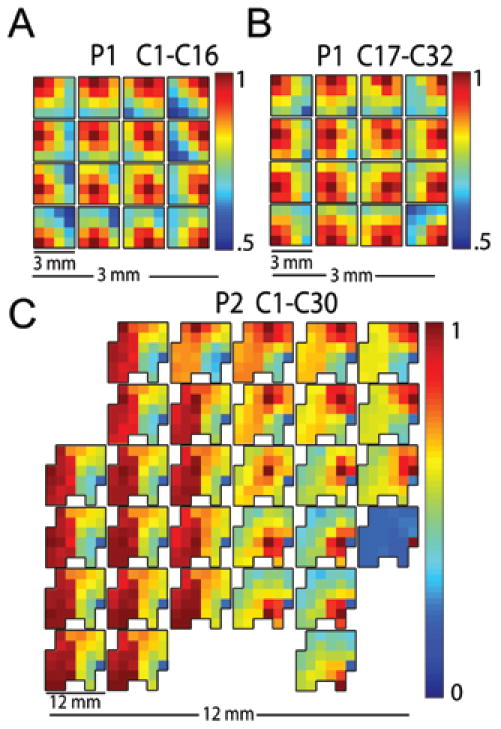
Fig. 3.
Gamma band (30–80 Hz) pairwise cross-correlations between each nonpenetrating microwire and all other microwires within an array. A: Array correlation, channels 1–16 (orange wire in Fig. 1) in the patient in Case 1 (P1). B: Array correlation in Case 1, channels 17–32 (green wire in Fig. 1.). C: Array correlation, 30 channels obtained in the patient in Case 2 (P2). The physical layouts of the devices in this figure are shown at 2 scales. At each location in the array, a miniature replica of the entire array indicates the pairwise cross-correlation of that nonpenetrating microwire with all other microwires in the array. The location itself is identifiable in the miniature replica by the dark red pixel showing the autocorrelation. Both arrays in Case 1 show an inverse relationship between correlation strength and distance. High correlation between microwires in the anterior portion of Case 2, located over the hand area of primary motor cortex, contrasts with the decay seen in the posterior portion, which rested over the parietal cortex. The variation evident in correlation strength across arrays suggests that nonpenetrating microwire arrays can capture higher spatial resolution detail of neuronal signals than standard 5-mm-diameter ECoG electrodes that might rest over the same surface area. Note that the color scale is optimized to visually emphasize the correlation drop across a device.

