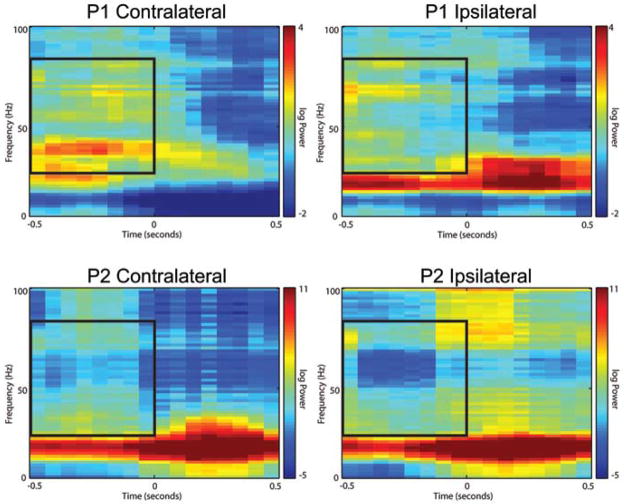
Fig. 4.
Spectrograms from a single nonpenetrating microwire for each patient demonstrating increased power in the gamma band during the planning phase for movement in the contralateral versus ipsilateral direction. These spectrograms are aligned at the 0-second tick to an outward reach movement. Recorded data from the nonpenetrating microwires were band-pass filtered to 5–150 Hz. Spectrograms were generated using the Chronux routines with a moving window of 250 msec and 50-msec step size; additionally, spectrograms were normalized to the average spectrum across time within the 1-sec window as described in the Methods section. Movement in the left column is toward the target contralateral to hemisphere in which the array was implanted; movement in the right column is toward the ipsilateral direction. Inlaid boxed area represents an outline of the gamma band for the planning stage evaluated in Fig. 7. Although only a single electrode is shown, the results are representative of most electrodes on each array.

