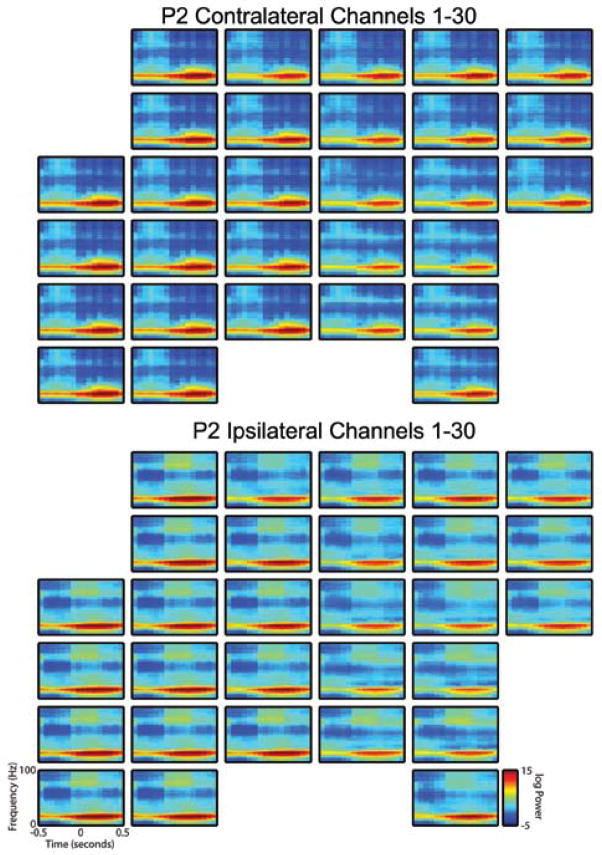
Fig. 6.
Spectrograms from all nonpenetrating microwires in the second patient (P2) demonstrating increased power in the gamma band during the planning phase for movement in the contralateral versus the ipsilateral direction. Spectrograms were generated as described in the Methods section and the legend to Fig. 4. Upper panels show spectral content for movement toward the target contralateral to implantation hemisphere; the lower panels represent movement toward the ipsilateral direction.

