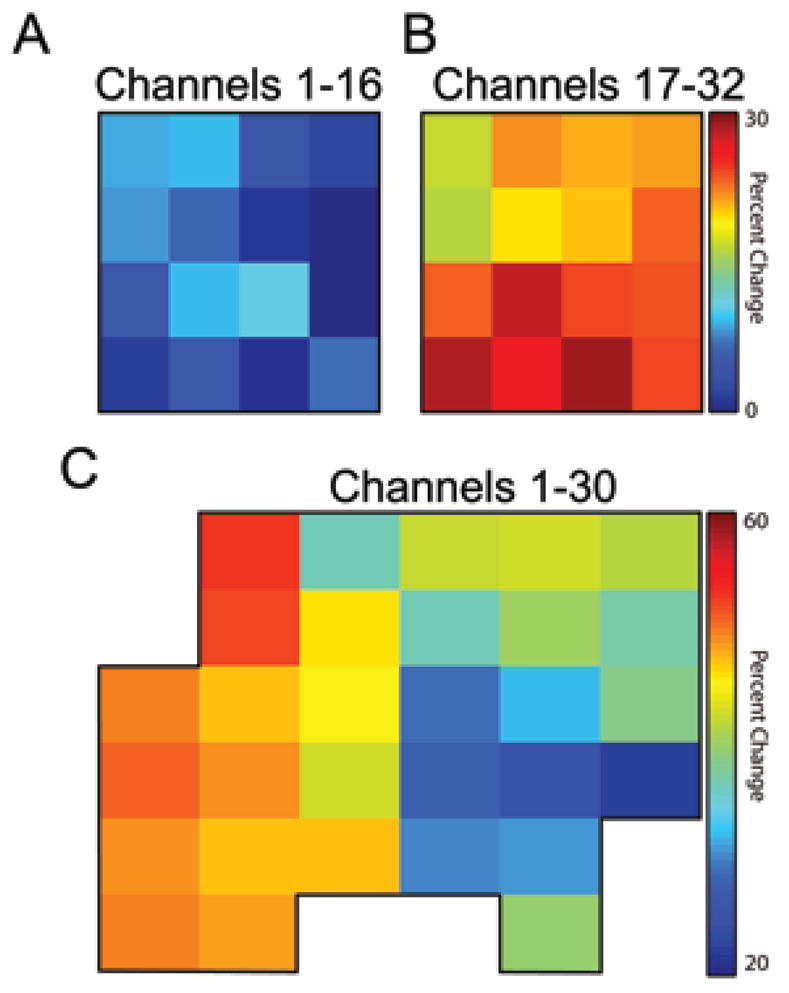
Fig. 7.

Plots showing, for each nonpenetrating microwire channel in each patient, the percent change in average gamma-band power during planning for movement in the contralateral direction over movement in the ipsilateral direction. After generating spectrograms for each channel as shown in Fig. 4, values for frequencies between 30 and 80 Hz and the full 500 msec before movement were averaged to a single value representative of the power over the entire gamma band during the movement planning phase. The difference between these mean values, normalized to the contralaterally directed mean values, is shown. In A and B, the percent change between contralaterally and ipsilaterally directed movement is shown for both electrode arrays implanted in the patient in Case 1. The disparity in magnitude of percent change between arrays is indicative of the underlying structure: channels 17–32 were located over the upper extremity primary motor cortex, whereas channels 1–16 were located more inferiorly along the precentral gyrus. In C, the percent change between the contralateral and ipsilateral direction is shown for all 30 channels in the second patient. The patterns evident in C also correspond closely to the underlying anatomy as noted in the Discussion section.
