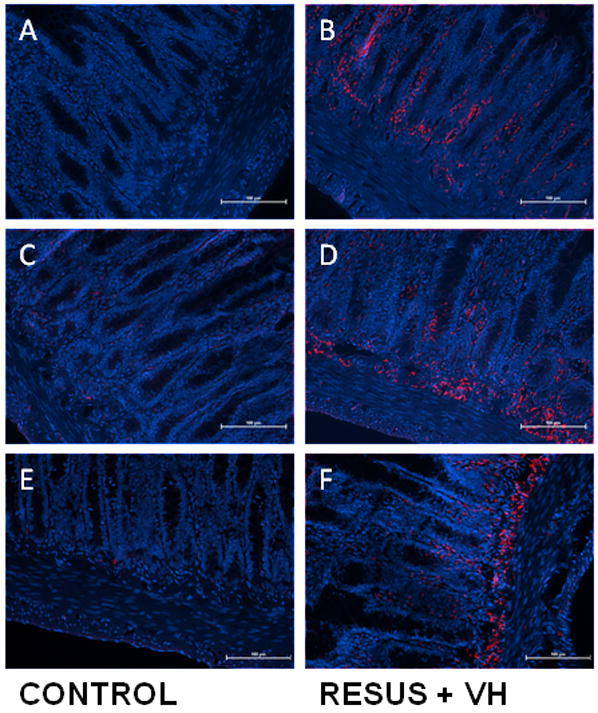
Figure 4.

Figure 4a–f: Representative images demonstrating immunofluorescent staining of NHE-1 (A, B), NHE-2 (C, D), and NHE-3 (E, F) in ileum of CONTROL and RESUS + VH animals. Note the significant upregulation of NHE-1, 2, and 3 in the RESUS + VH (edema) group as compared to CONTROL, with a predominance of staining at the submucosa/muscularis interface. All images are 20x. (blue – DAPI; red – NHE-1, 2, and 3, respectively)
