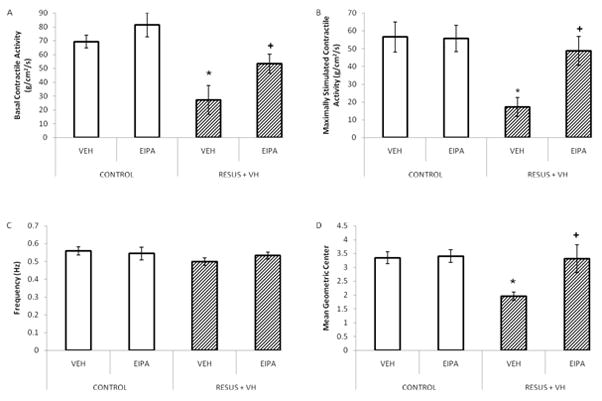
Figure 7.

Figure 7a–d: Intestinal function measured in the ileum 6 hours after surgery in CONTROL and RESUS + VH groups treated with VEH or EIPA. Panel A, Basal (un-stimulated) contractile activity; Panel B, Carbachol stimulated contractile activity; Panel C, Contractile frequency; Panel D, Intestinal transit. Values represent mean ± SEM. (Panels A–C, n=6 per VEH treatment group; n=7 per EIPA treatment group; Panel D, n=6 per group; *, p<0.05 versus CONTROL; +, p<0.05 versus RESUS + VH + VEH)
