
Figure 3.
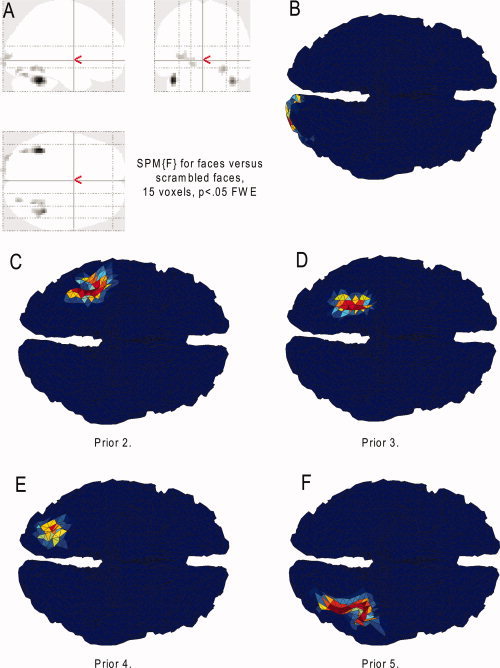
Thresholded SPM{F} for fMRI analyses in MNI space from a group of 18 participants (A), together with the patches interpolated and smoothed on the MNI template cortical mesh from. As viewed from underneath, the five fMRI clusters (B–F). Color reflects F‐value (scale irrelevant other than blue regions having value zero).