
Figure 6.
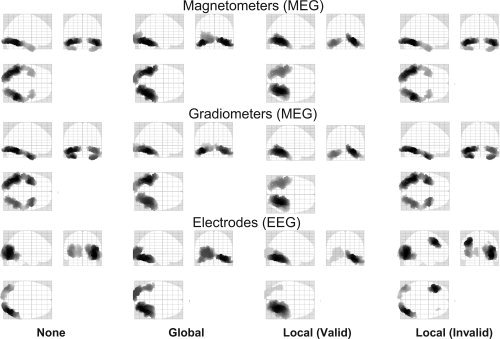
Mean conditional source reconstructions across participants for each modality and model in Analysis 1 (MNM and binary, variance components). Each panel shows a maximal intensity projection (MIP) of the 512 greatest source strengths within MNI space. For illustration purposes, the source estimates have been smoothed on the 2D mesh surface via 32 iterations of an unweighted graph Laplacian with adjacency ratio (c.f., autoregression coefficient) of 1/16.