
Figure 7.
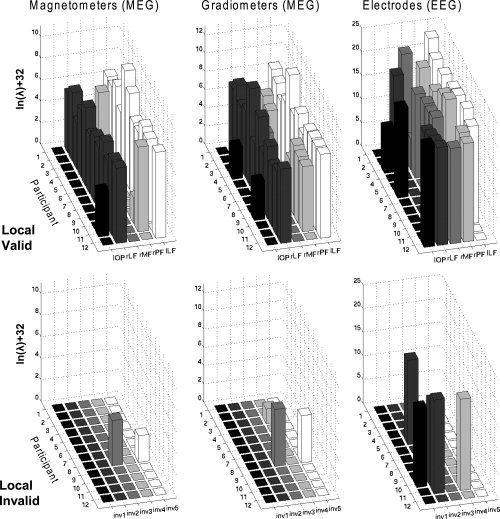
Hyperparameters for each modality and model in analysis 1 (MNM and binary, variance components). The z‐axis represents the increase in the natural log of the hyperparameters relative to their prior value (a natural log of −32) and is not comparable across sensor types (owing to different scaling and physical units).