
Table 2.
Quantitative Results Obtained from 10 Healthy Volunteers
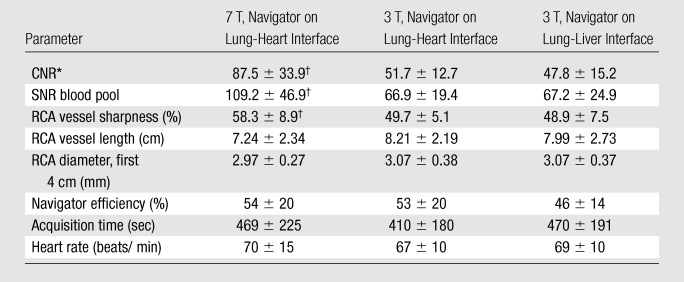
Note.—Data are mean ± standard deviation.
*
CNR between the blood pool and epicardial fat surrounding the proximal RCA.
†
Significantly different from 3 T (P < .05).
Official websites use .gov
A
.gov website belongs to an official
government organization in the United States.
Secure .gov websites use HTTPS
A lock (
) or https:// means you've safely
connected to the .gov website. Share sensitive
information only on official, secure websites.
Quantitative Results Obtained from 10 Healthy Volunteers
Note.—Data are mean ± standard deviation.
CNR between the blood pool and epicardial fat surrounding the proximal RCA.
Significantly different from 3 T (P < .05).