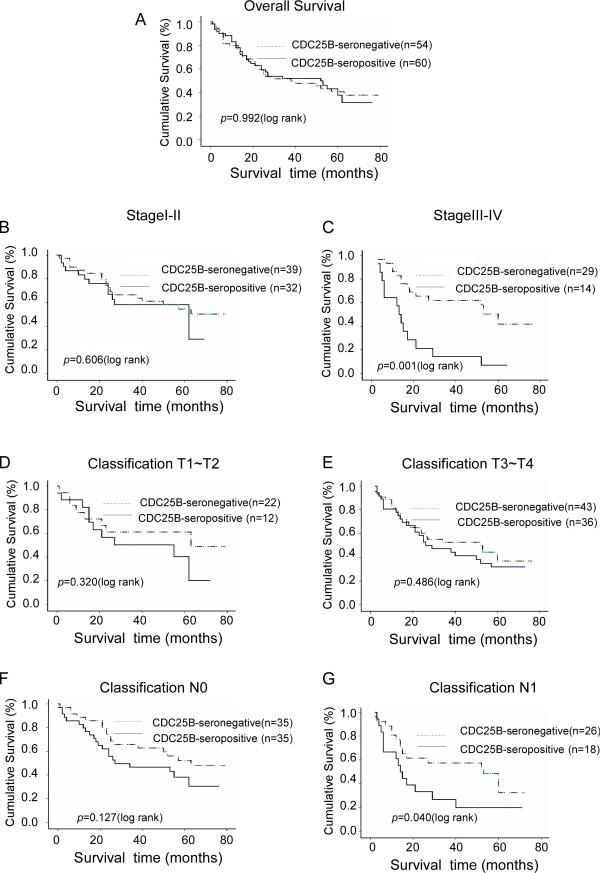
Figure 3.
Kaplan-Meier curves with univariate analyses (log-rank) for patients with positive CDC25B expression versus negative CDC25B expression. The five-year survival rates of seropositive (bold line) and seronegative (dotted line) ESCC patients are not significantly different (A, P = 0.992, log-rank). The survival rates of CDC25B-seropositive and CDC25B-seronegative patients were compared in subgroups with stage I-II (B) and stage III-IV ESCC (C). The same comparison was carried out in patients classified into the T1-T2 (D), T3-T4 (E), N0 (F) and N1 (G)groups. P values were calculated using the log-rank test.

