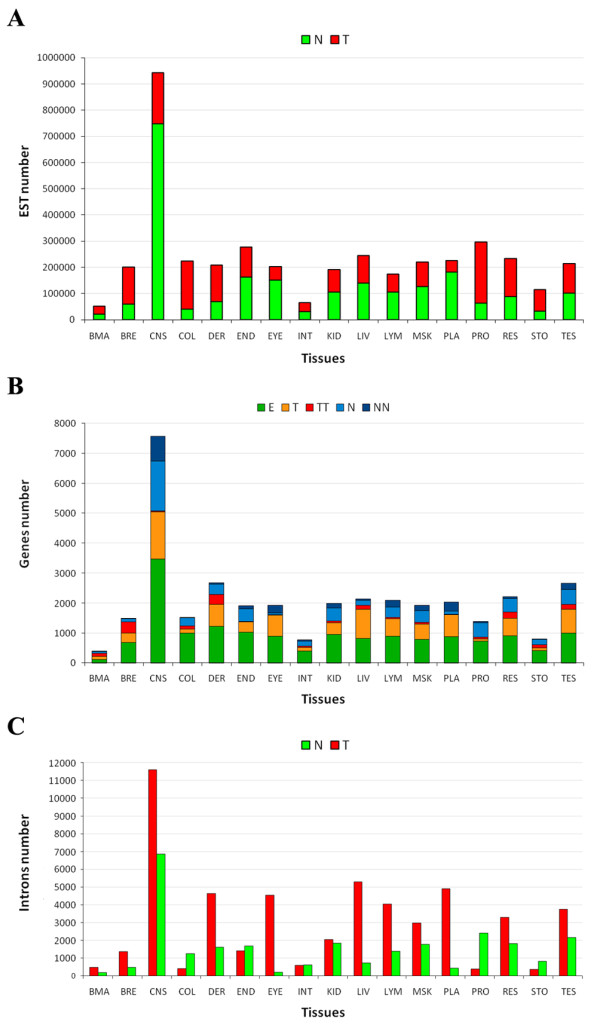
Figure 1.

Genes and introns classification based on ESTs data analyses. (A) Number of available ESTs for each tissue, classified as normal (N) or tumoral (T), according to the CGAP classification. (B) Number of genes analyzed for each tissue, classified on the base of their expression in the normal (N and NN) and tumoral (T and TT) status and of comparable expression in both conditions (E). (C) Number of tumoral (T) and normal (N) specific introns for each tissue. BMA: Bone marrow, BRE: Breast, CNS: Central nervous system (e.g. brain); COL: Colon; DER: Skin; END: Endocrine system; EYE: Eye; INT: Gastrointestinal tract; KID: Kidney; LIV: Liver; LYM: Lymphoreticular system; MSK: Musculoskeletal system; PLA: Placenta; PRO: Prostate; RES: Respiratory System; STO: Stomach; TES: Testis
