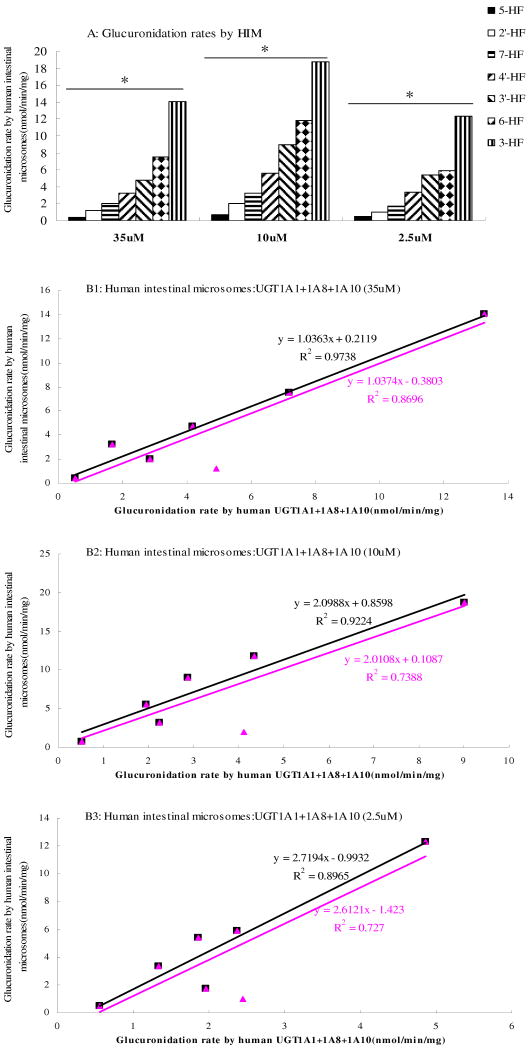
Fig.9. Glucuronidation of Seven HFs by Pooled Human Intestinal Microsomes (Fig.9A) and Correlation Between Glucuronidation Rates Derived from UGT Isoforms and Those from Human Intestinal Microsomes at Concentrations of 35 μM (Fig.9B1), 10 μM (Fig.9B2) or 2.5 μM (Fig.9B3).
In Fig.9A, each column represents the average of three determinations and the error bar represents the standard deviation of the mean. Significant differences at each concentration by each UGT were found among the seven HFs (p<0.05, One-way ANOVA, marked by *). In Fig.9B1∼B3, the glucuronidation rates by human intestinal microsomes (X-axis) was plotted against expressed UGT isoform (UGT1A1+UGT1A8+UGT1A10) rates. The linear regression was used to derive the apparent correlation coefficient. The blank lines are the ones with all seven hydroxyflavones, whereas the pink lines are the one without 2′-hydroxyflavone.

