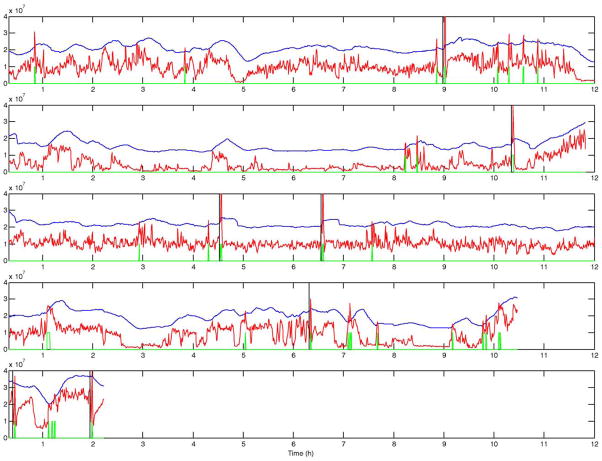
Fig. 2.
STE (red), decision threshold (blue), prediction output (green), and seizure onset (black vertical line) for 5 records from patient B. Positive outputs (high level in green curve) are observed as far as almost 2 h before all seizures. Note that the there is no positive output between the clustered seizures on the third display.

