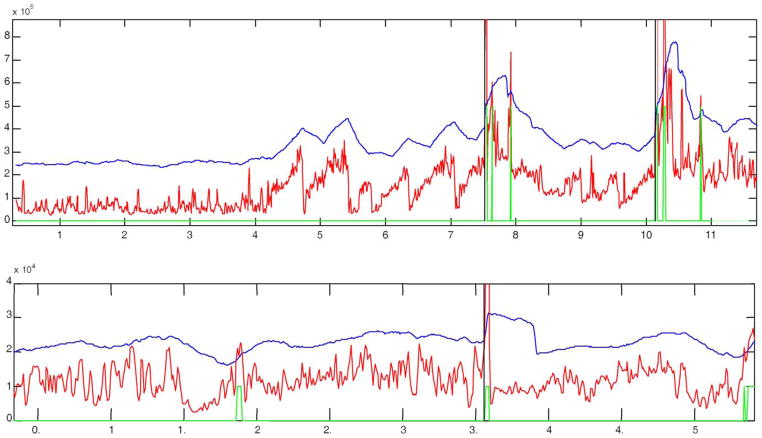
Fig. 7.
Examples of pre-ictal energy bursts build-up patterns. Top panel is a clip from patient C and bottom panel is a clip from patient E. Note how in the top panel the energy builds up and then suddenly decreases 5 times before it finally evolves into a seizure. In the bottom display the energy is initially high, reaching higher peaks over time and then suddenly decreasing around 1.6 h, and start to build up again with some drops before it evolves into a seizure around 3.6 h from the beginning of this record.

