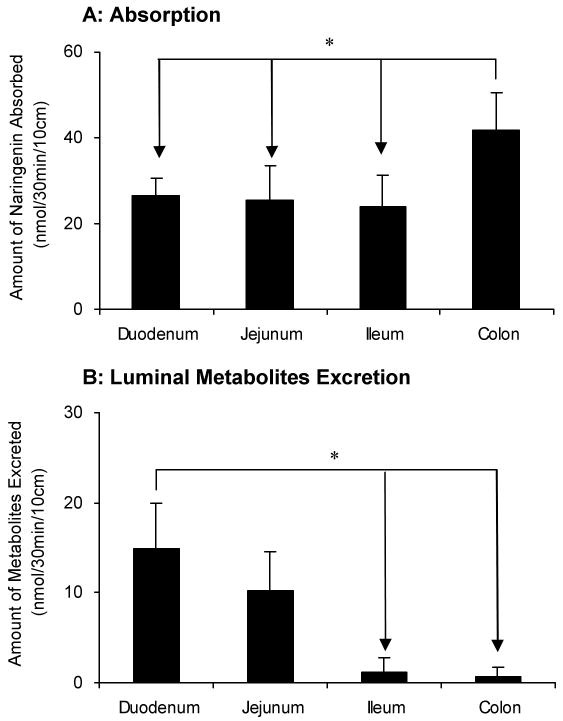
Figure 4.
Amounts of aglycone absorbed (A) and amounts of glucuronides excreted in the intestine (B) in a four-site rat intestinal perfusion model (n = 4). Perfusate contained 10 μM naringenin and four segments of the intestine (i.e., duodenum, upper jejunum, terminal ileum, and colon) were perfused simultaneously at a flow rate of 0.191 ml/min. The data for the intestinal absorption and metabolite excretion shown in this figure are expressed as average of 4 times intervals starting from 30 minutes up to 150 minutes of experimental period. The “*”symbol indicates statistically significant differences (p < 0.05) between amounts excreted in different intestinal segments according to one-way ANOVA with Tukey-Kramer multiple comparison (posthoc) tests.

