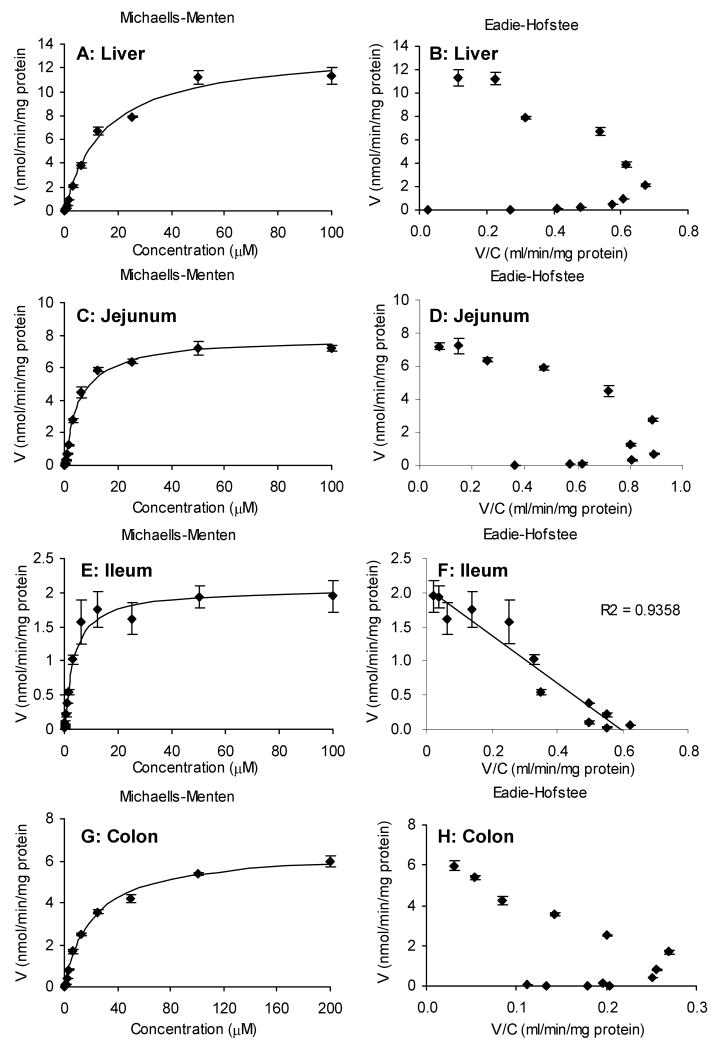
Figure 6.
Glucuronidation rates of naringenin in rat liver (A), jejunum (C), ileum (E), and colon (G) microsome as a function of concentration (n = 3). Rates of metabolism were determined from 48.8 nM to 100 μM for all the microsomes except from 48.8 nM to 200 μM for colon microsomes. The final protein concentrations were 13 μg/ml for liver and jejunum microsome, 26 μg/ml for colon microsomes, and 52 μg/ml for ileum microsome. The reaction time was 30 min for liver, jejunum, and colon microsome and 40 min for ileum microsome as described in the methods. Eadie-Hofstee plots (B, D, F, H) were generated to determine which equation was used for data fitting.

