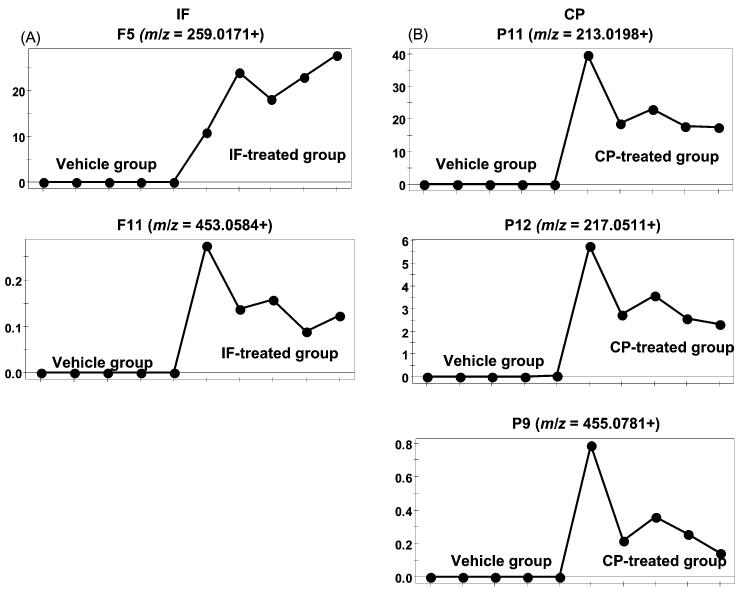
Fig. 3.
Trend plots of ions from novel metabolites in the treatment groups. (A) Novel IF metabolites with m/z values of 259.0171 (F5) and 453.0584 (F11). (B) Novel CP metabolites with m/z values 213.0198 (P11), 217.0511 (P12), and 455.0781 (P9). Note the absence of suspected drug metabolites in the vehicle-treated group. Metabolite codes correspond to those in Fig. 4.

