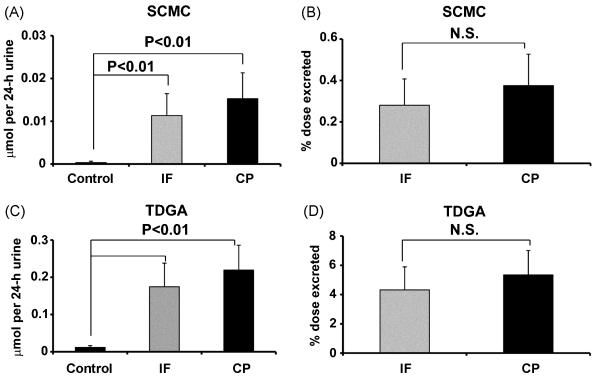
Fig. 6.
The amount (μmol/24h) and % dose excreted for SCMC and TDGA in 0-24 h mouse urines following treatment with IF and CP. (A) The μmol/24h of SCMC from IF- and CP-treated mice. (B) Percent dose excretion of SCMC from IF- and CP-treated mice. (C) The μmol/24h of TDGA from IF- and CP-treated mice. (D) Percent dose excretion of TDGA from IF- and CP-treated mice. N.S. means not significant. Note the small amounts of SCMC and TDGA excreted in blank (control) 0-24 h mouse urines.

