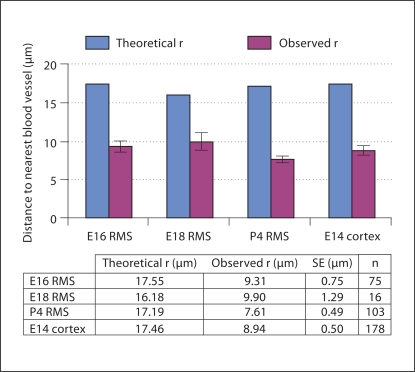
Fig. 5.
Quantification of the relationship between mitotic cells and blood vessels. The graph compares the average distance of a mitotic cell from a blood vessel (observed r; red bars) to a theoretical average distance derived from the model for any cells within the sphere of influence (theoretical r; blue bars). Analysis was performed for E16, E18 and P4 RMS, with E14 cortex used as an internal control. Error bars indicate standard errors (SE). The observed r was significantly smaller than the theoretical r in all cases (p < 0.0005, one-sample Student's t test). Therefore, mitotic cells were closer to blood vessels than predicted by chance. Furthermore, there was no significant difference in observed r between the RMS of different ages and compared to E14 cortex (p = 0.1832, one-way ANOVA).

