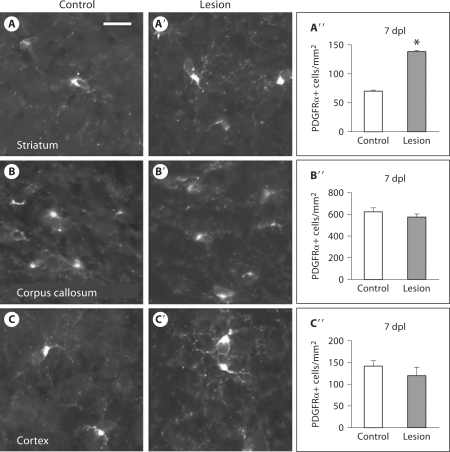
Fig. 2.
HI increases PDGFRα+ cells within the striatum. Immunofluorescence for PDGFRα+ 7 dpl showed a significant increase in PDGFRα+ cells within the striatum: control (magnification ×40, scale bar = 50 μm) (A), lesion (A′), quantification of PDGFRα+ cells (error bars represent SEM, n = 5 controls and 7 lesions, ∗ p = 0.003) (A″); but no significant change within the corpus callosum: control (B), lesion (B′), quantification (B″), and no significant change within the cortex: control (C), lesion (C′), quantification (C″).

