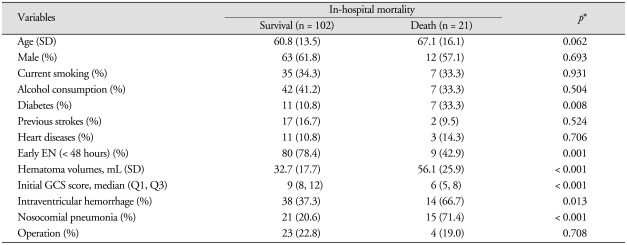
Table 3.
The univariate analysis of 123 patients according to in-hospital mortality after intracerebral hemorrhage
*p value for differences between survival and death group after intracerebral hemorrahge; Pearson χ2 or Fisher's exact test, Student t-test, Mann-Whitney test as appropriate. EN : enteral nutrition, GCS: Glasgow coma scale, SD : standard deviation

