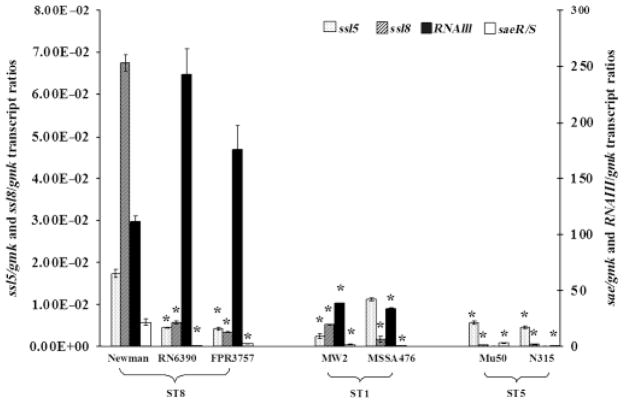
Fig. 1.
Transcript ratios of ssl5/gmk, ssl8/gmk, RNAIII/gmk, and sae/gmk quantified at the early stationary phase of seven strains: RN6390, FPR3757, Newman, MW2, MSSA476, Mu50, and N315. The dotted and the hatched bars on the primary axis show ssl5/gmk and ssl8/gmk transcript ratios, respectively. The closed and open bars are relative to the secondary axis and show RNAIII/gmk and sae/gmk transcript ratios. Data represented here show the mean values of two independent measurements. An asterisk (*) denotes that the values are statistically significant (i.e. P<0.05, by Student’s t-test) compared with the Newman strain.

