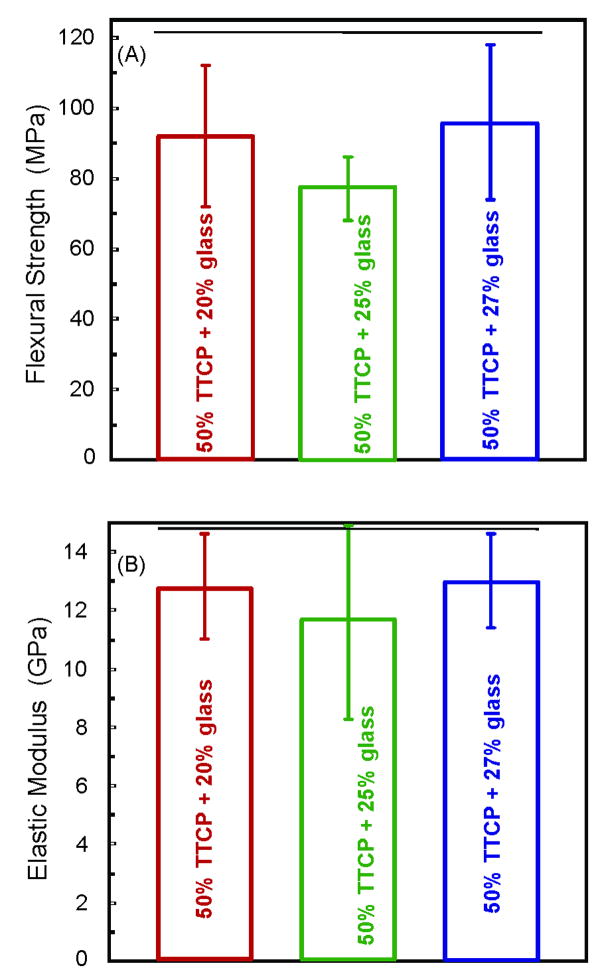
Figure 5.
Group 4 with a TTCP filler level of 50% (higher than the 40% TTCP in Figure 2), reinforced with various glass filler amounts. The purpose was to increasing the TTCP filler level for increased Ca and PO4 release, without compromising the mechanical properties. Horizontal line indicates values that are not significantly different from each other (p > 0.1). The strengths of Figure 5 were similar to those in Figure 2 (p > 0.1). Each value is mean ± sd; n = 6.

