Fig. 1.

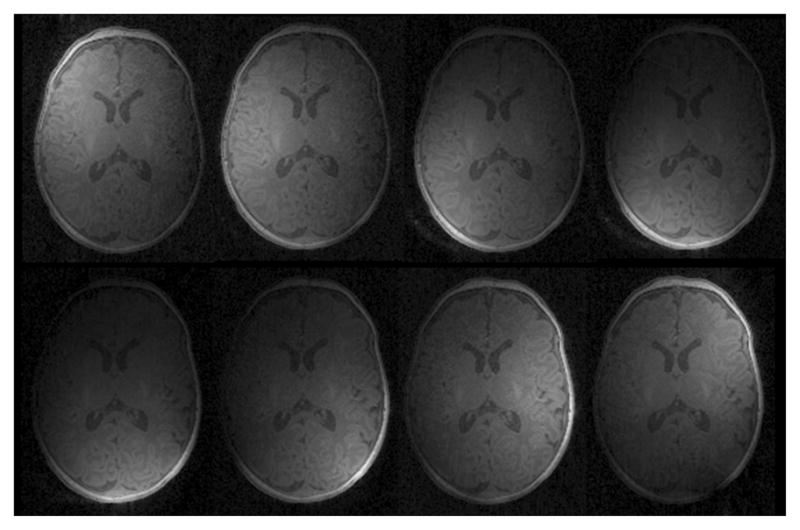
Eight T1 MR images obtained from the eight phased array coil elements. Each image has different sensitivity region, corresponding to the individual location of each coil.

Eight T1 MR images obtained from the eight phased array coil elements. Each image has different sensitivity region, corresponding to the individual location of each coil.