
Figure 2.
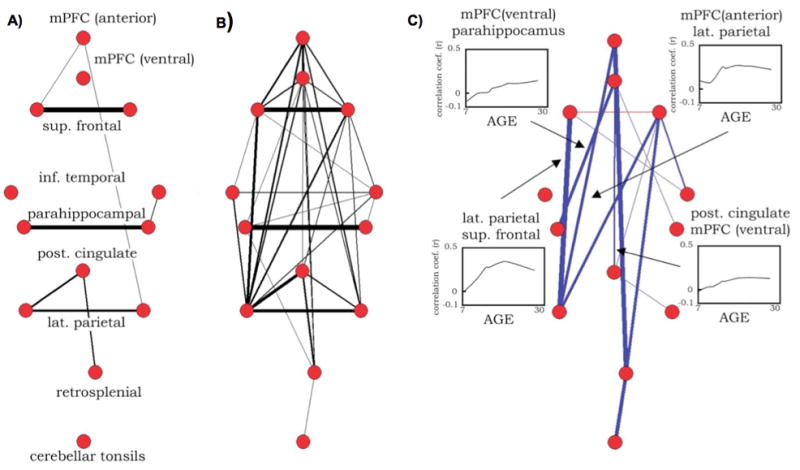
Pseudo-anatomical layouts of a network of 13 DMN ROIs in (A) children 7–9 years old and (B) adults 21–31 years old. Connection widths indicate the strength of correlation between ROI timecourses, and only correlations of r > 0.15 are shown. (C) The results of a two-tailed t-test of children and adult correlations corrected for multiple comparisons at P < 0.05. Correlations that increased with age are shown in blue, and those that decreased with age are shown in red. Insets show LOWESS curves of several individual connections over development. ROIs were defined from (Fox et al., 2005). Figure modified from (Fair et al., 2008).