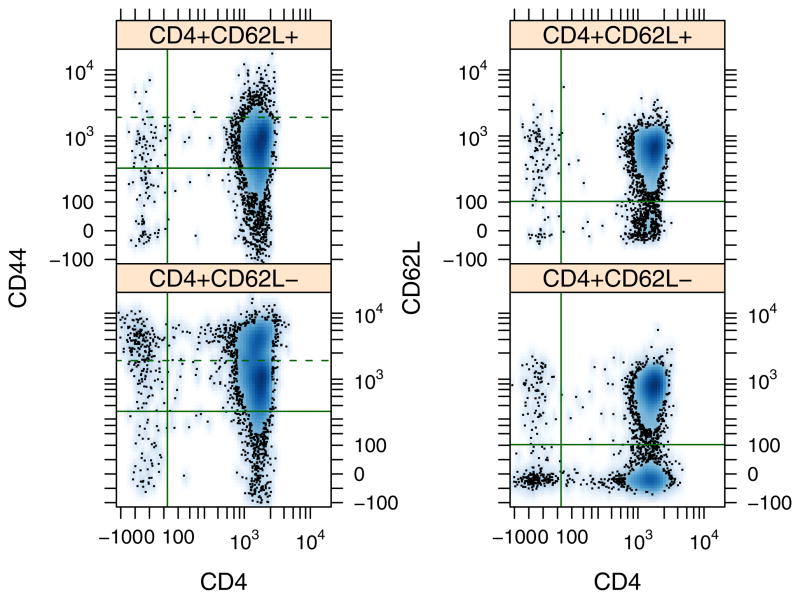
Figure 2.
Pairwise density plots for CD4, CD62L, and CD44 expression shown separately for aliquots obtained from CD4+CD62L+, and CD4+CD62L− fractions. Each panel corresponds to a particular pair: CD44 versus CD4 (left panel) and CD62L versus CD4 (right panel). The solid lines indicate the expression threshold for a cell to be associated with positive expression. Ninety five percent of the unstained cell fraction was contained below the threshold. The dotted line indicates the upper limit of CD44 expression for 95% of the CD4+CD62L+ fraction.

