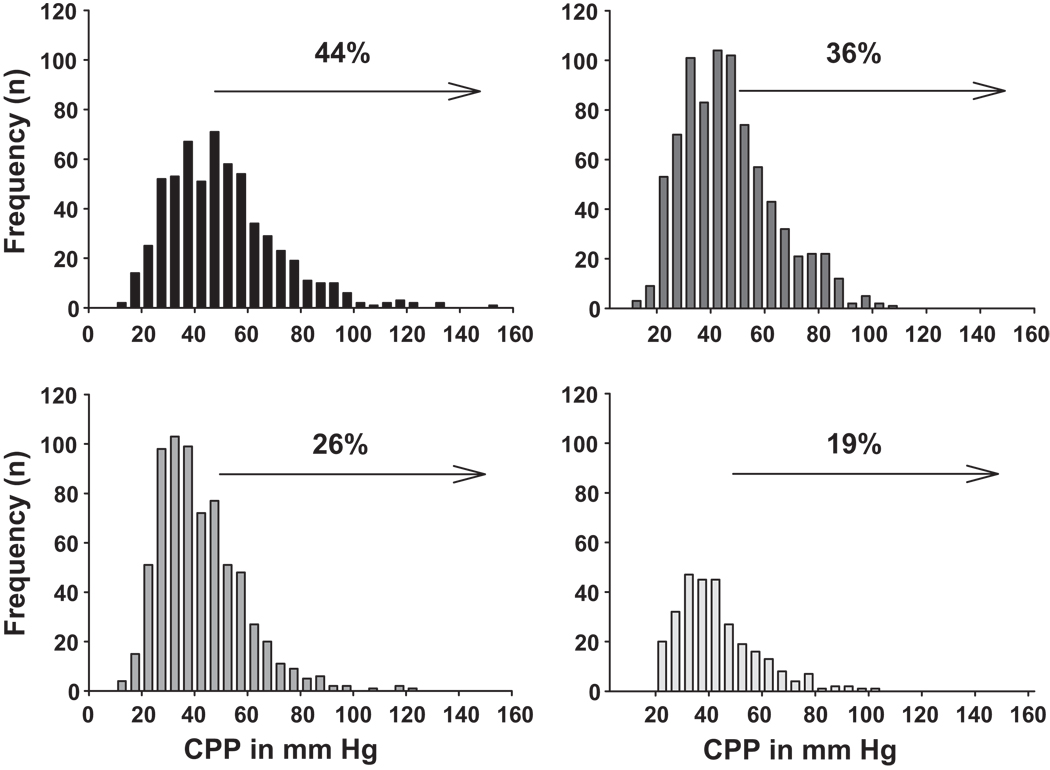
Figure 2.
Upper Left panel plots central pulse pressure in 10 mmHg increments among those with eGFR < 30 mL/min/1.73m2. Upper Right plots those with eGFR 30–44.9, Lower Left plots those with eGFR of 45–59.9 and the Lower Right panel depicts those with an eGFR > 60. Arrow onset marks Central Pulse Pressure (CPP) of 50 mmHg and percent (%) indicates the portion of participants within that eGFR range with a CPP > 50 mmHg.

