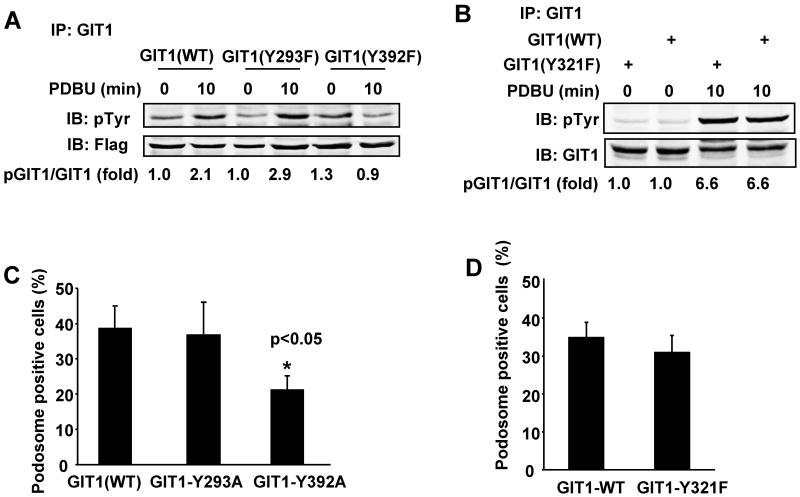
Figure 3. Role of GIT1-Y293, -Y321, and –Y392 in PDBU-induced GIT1 tyrosine phosphorylation and podosome formation.
Effects of GIT1 tyrosine mutants on PDBU-induced GIT1 tyrosine phosphorylation. HEK293 cells were transfected with Flag-GIT1 (WT), Flag-GIT1 (Y293F), and Flag-GIT1 (Y392F) (A) or Xpress-GIT1 (WT) or Xpress-GIT1 (Y321F) (B) for 24 hours. Cells were starved for 6 hours and then treated with or without 1μM PDBU for 10 min. Cell lysates were immunoprecipitated with Flag antibody or Xpress antibody, then immunoblotted using 4G10 antibody to detect pGIT1 (top panel), and reprobed to detect GIT1 (lower panel). The blots were analyzed by densitometry using LiCor software. Fold changes normalized to the first lane are shown below the blots (n=2-3). Effects of GIT1 tyrosine mutants on PDBU-induced podosome formation. A7r5 cells were transfected with different GIT1 mutants for 24 hours followed by treatment with or without 1μM PDBU for 60 min. Cells were stained for GIT1 and podosomes. Percentage of podosome positive cells (%) were counted and analyzed only in cells expressing GIT1 mutant (with green fluorescence). Quantified data are presented as percentages of podosome positive cells in GIT1 mutant positive cells (n=100 cells per dish). All values are expressed as mean ± SD of three independent experiments performed in triplicate. A p value < 0.05 was considered to be statistically significant (*)

