
Figure 10. Differential gene expression in the ankle joints of mice in the presence/absence of SphK1.
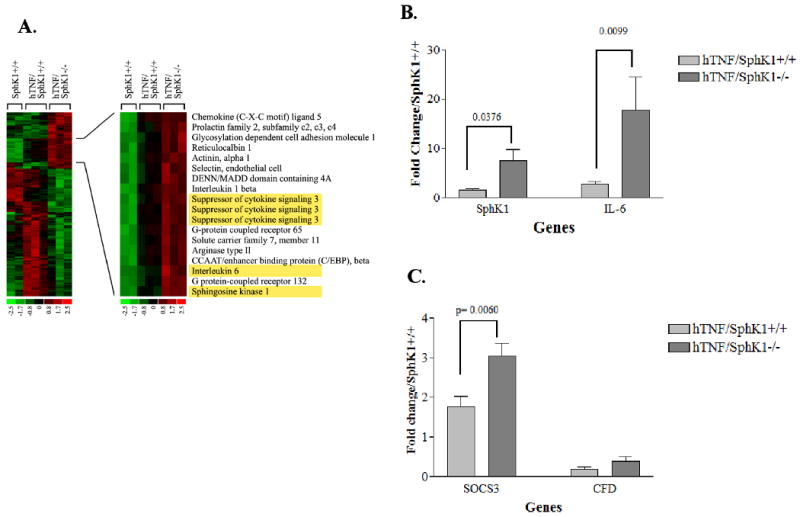
Heat map of microarray expression data for (A) from SphK1+/+ (n=2), hTNF/SphK1+/+ (n=3) and hTNF/SphK1-/- (n=3) mice. Left panel shows profiles for all genes differentially expressed. Right panel shows a subset that is upregulated. Yellow boxes represent genes further investigated in these mice (A). Real time RT- PCR confirmation of microarray analysis of SphK1 and IL-6 (B), SOCS3 and complement factor D (CFD) (C). CFD was used as a no difference control. Each gene measured in triplicate; p-values (Student's t test) are noted above the brackets.