
Figure 7. Serum S1P levels in hTNF and SphK1 mice.
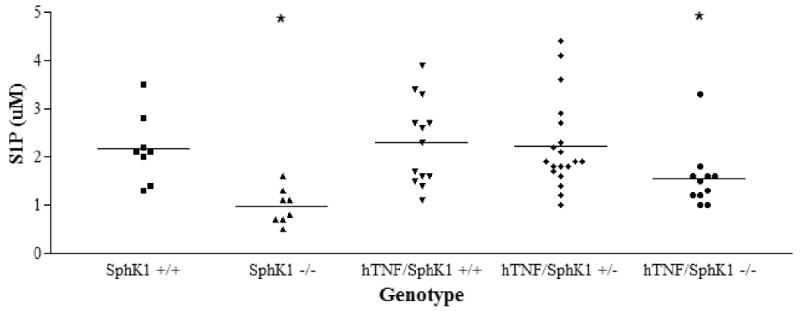
Less S1P was detected in SphK1-/- mice and hTNF/SphK1-/- mice compared to other groups of mice. n ≥8, *p<0.05 by ANOVA
Official websites use .gov
A
.gov website belongs to an official
government organization in the United States.
Secure .gov websites use HTTPS
A lock (
) or https:// means you've safely
connected to the .gov website. Share sensitive
information only on official, secure websites.
Less S1P was detected in SphK1-/- mice and hTNF/SphK1-/- mice compared to other groups of mice. n ≥8, *p<0.05 by ANOVA