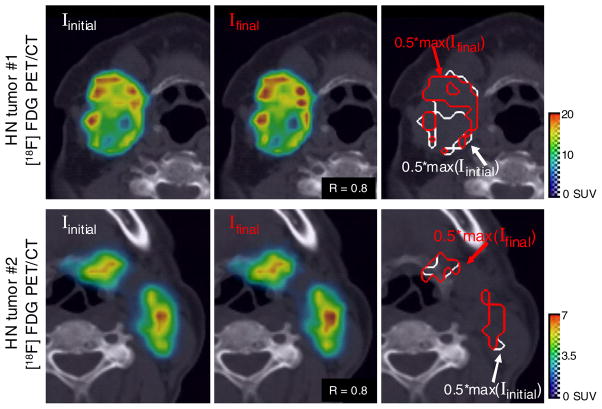
Figure 7.
[18F] FDG-PET tracer distribution in heterogeneous HN tumours, and the apparent redistribution and quantitative errors that would occur if this patient were subsequently scanned; however, the patient was placed at a slightly different position in the scanner bore (due to a random set-up error). Set-up errors were modelled as rigid translations along six degrees of freedom, where the magnitude and the direction of motion were randomly sampled from Gaussian distributions with standard deviations of σ(Δx) = 4.4 mm, σ(Δy) = 5.1 mm σ(Δz) = 3.4 mm. All images show identical cross-sectional slices through the tumour. Images to the far left show that the clinical reference PET and images in the central column are the resulting images created by calculating the changes in voxel values that occur with the relative position of the tumour. The Pearson correlation coefficient between the initial and final PET images shown here was 0.8. The isolines shown in the images to the far right demonstrate the effect of the variations in voxel values on the delineation of targets volumes.

