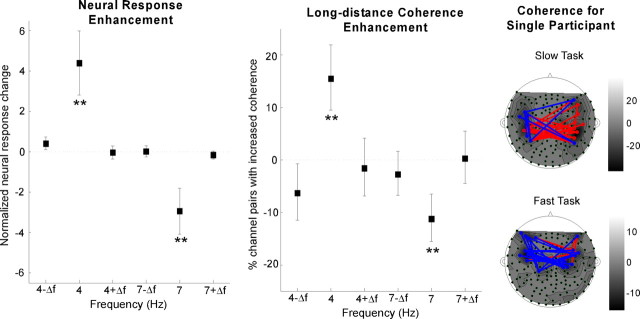
Figure 3.
Power and phase enhancement during the attended task. Left, Normalized neural response difference between slow and fast tasks shows enhancement exclusively at target rates (4 Hz for the slow task, 7 Hz for the fast task). Error bars represent SE. The asterisks at 4 and 7 Hz shows that only these frequencies yield a statistically significant enhancement. Middle, Phase coherence difference between the slow and fast tasks showing enhancement exclusively at target rates. Error bars represent SE. The difference between number of channel pairs with robust increased coherence and channel pairs with decreased coherence is normalized over the total number of long-range channel pairs. Right, Channel pairs with robust coherence difference at target rates for single subject, overlaid on the contour map of normalized neural response at target rates. The channel pairs with increased (decreased, respectively) coherence at target rates is shown by red (blue, respectively) lines.

