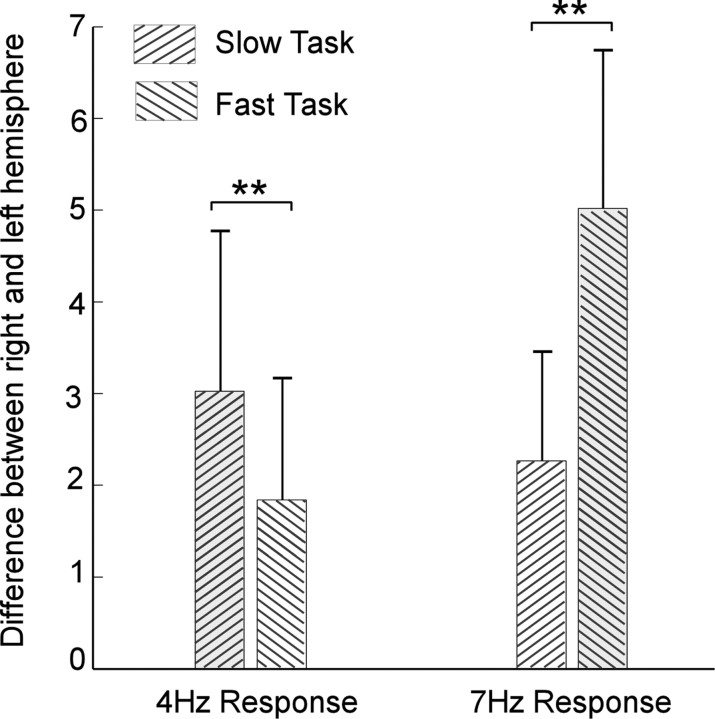
Figure 4.
Neural responses to target rates across hemispheres. The 20 channels with the strongest normalized neural response at target rates are chosen from left and right hemisphere, respectively, to represent the overall neural activity of each hemisphere. Neural responses averaged across the 20 channels are subtracted across hemispheres for each task and for all subjects. Error bars represent SE. **p < 0.04.

