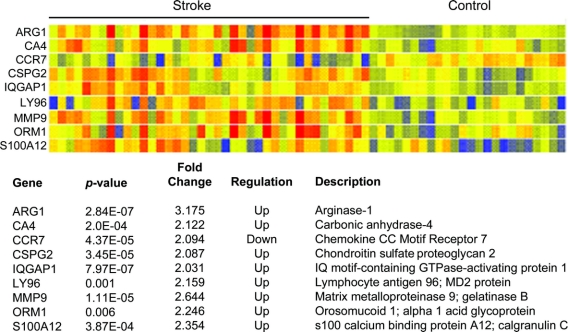
Figure 1 Stroke gene profile
After comparison between both statistical packages, there were 9 genes differentially expressed with at least a 2-fold difference in expression and Bonferroni-corrected p < 0.05 between stroke patients and control subjects (ARG1, CA4, CCR7, CSPG2, IQGAP1, LY96, MMP9, ORM1, S100A12).

