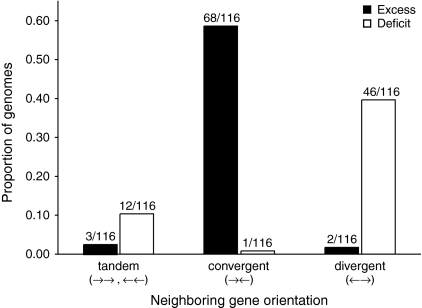
FIG. 1.—
Proportion of fully sequenced bacterial chromosomes with a significant excess or deficit of IS elements in each NGO. Each bar is labeled with the number of excesses or deficits relative to the number of genomes analyzed (i.e., the number of genomes with enough IS elements for statistical analysis; see text).

