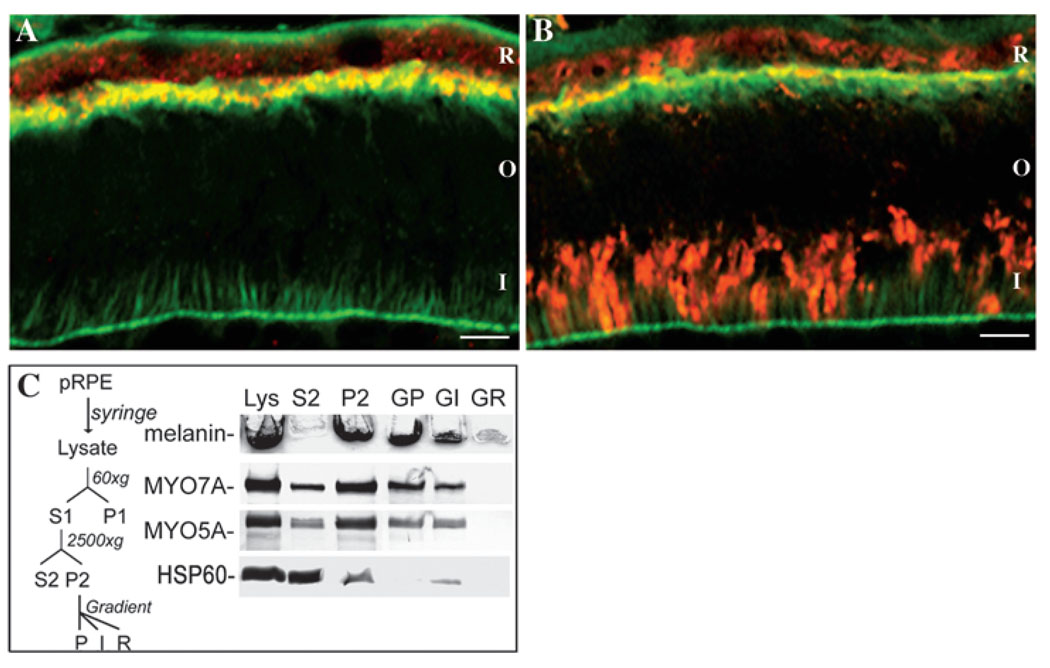
Fig. 5.
Mouse retinal cryosections immunolabeled with antibodies against (A) myosin VIIa or (B) myosin Va (both red), and also labeled with BODIPY-FL-phallacidin (green) to indicate actin filaments. A region of overlap is evident as a yellow band. Myosin Va is also evident in the photoreceptor inner segments. R, RPE; O, photoreceptor outer segments; I, photoreceptor inner segments. Bars, 10 µm. (C) RPE subcellular fractionation and immunoblot analysis. Left: Schematic of the fractionation procedure for purified pig RPE cells. Right: Analysis of RPE fractions. Each fraction was obtained from the same amount of starting material. Top strip: unstained stacking gel showing melanin content of each fraction, as an indication of the distribution of melanosomes. Lower strips: immunoblot labeled with myosin VIIa, myosin Va, and Hsp60 antibodies. All strips are from the same gel. Melanosomes are enriched in P2 and then in GP (and to a lesser extent in GI), following gradient separation. (GP, fraction from bottom of gradient; GI, fraction from interface; R, remainder.) Nuclei, as indicated by Trypan Blue staining were absent from GP. Labeling with Hsp60 antibody (a mitochondrial marker) indicates that mitochondria were depleted from P2 and GP.

