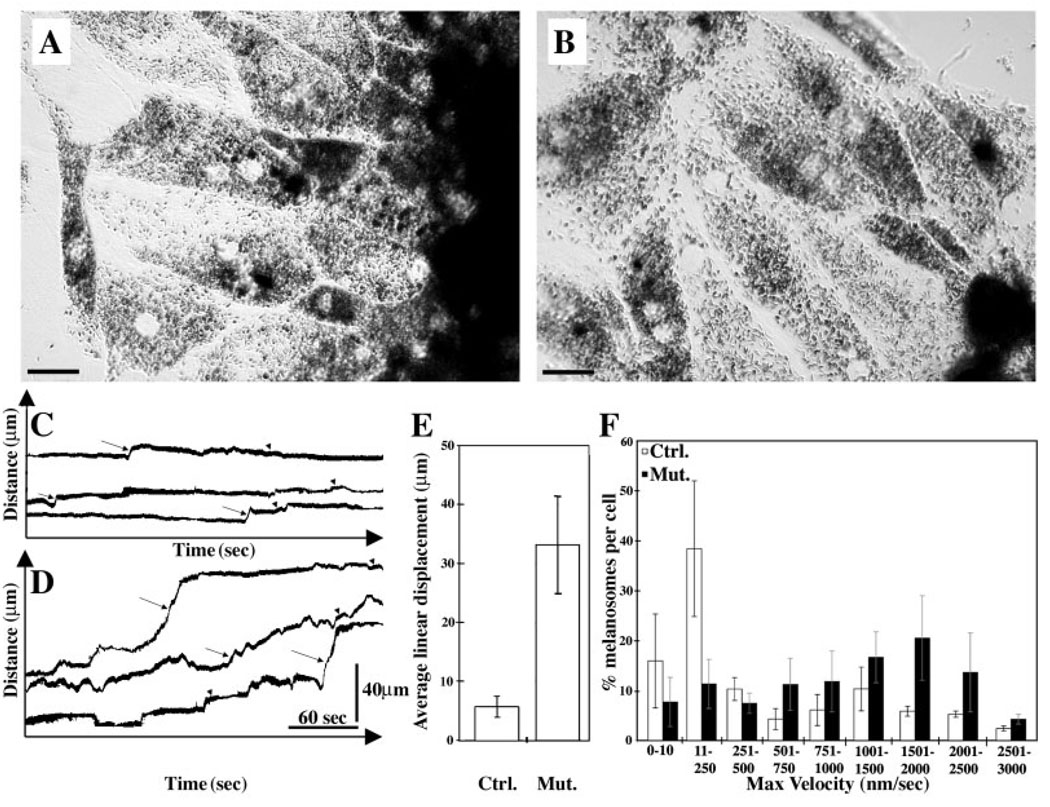
Fig. 8.
Time-lapse microscopy of melanosome movements in cultured RPE cells. Phase-contrast micrographs of RPE cells cultured from (A) shaker1 control (Myo7a+/4626SB) and (B) shaker1 mutant (Myo7a4626SB/4626SB) mice. Bars, 20 µm. Representative kymograph traces illustrating the movements of individual melanosomes in control (C) and mutant (D) RPE cells. Arrows indicate bursts of rapid movement, and arrowheads indicate periods of slower movement. (E) Histogram illustrating the mean linear displacement resulting from single continuous rapid movements in control and mutant RPE cells (mean±s.d.). (F) Histogram illustrating the percentage of melanosomes per cell moving at different maximal velocities during 350-second periods in control and mutant RPE cells (mean±s.d.).

