Abstract
The value of events that predict future rewards, thereby driving behavior, is sensitive to information arising from external (environmental) and internal factors. The ventral prefrontal cortex, an anatomically heterogeneous area, has information related to this value. We designed experiments to compare the contribution of two distinct subregions, orbital and ventromedial, of the ventral prefrontal cortex to the encoding of internal and external factors controlling the perceived motivational value. We recorded the activity of single neurons in both regions in monkeys while manipulating internal and external factors that should affect the perceived value of task events. Neurons in both regions encoded the value of task events, with orbitofrontal neurons being more sensitive to external factors such as visual cues and ventromedial neurons being more sensitive to internal factors such as satiety. Thus, the orbitofrontal cortex emphasizes signals for evaluating environment-centered, externally driven motivational processes, whereas ventromedial prefrontal cortex emphasizes signals more suited for subject-centered, internally driven motivational processes.
Introduction
Motivation, that is, what causes an organism to act, is regulated by information arising from internal and external factors (Balleine and Dickinson, 1998; Berridge, 2004; Minamimoto et al., 2009). Internal, subject-related information is related to primary needs such as hunger or thirst, but also to spontaneously initiated cognitive processes. For instance, this is the case both when we go shopping simply because we are hungry and when we plan to go to the store at convenient times to maintain a sufficient food storage. The information about external, environment-related factors arises from sensory cues in the external world, for instance when we purchase the snack that just appeared in an advertisement.
Normal motivation relies on the ventral prefrontal cortex, a heterogenous area (Damasio, 1994; Cardinal et al., 2002; Cox et al., 2005; Ressler and Mayberg, 2007; Wallis, 2007; Berridge and Kringelbach, 2008). Based on cytoarchitectonics and connectivity, ventral prefrontal cortex appears to be segregated into two differentiable circuits: medial [ventromedial prefrontal cortex (VMPFC)], and orbital [orbitofrontal cortex (OFC)]. VMPFC is heavily interconnected with limbic and autonomic structures, and OFC is heavily interconnected with sensory areas (Ongur and Price, 2000). Behavioral and functional imaging results suggest that the anatomical segregation is accompanied by functional differences (Balleine and Dickinson, 1998; Egan et al., 2003; Gottfried et al., 2003; Kringelbach, 2003; Kable and Glimcher, 2007; Ostlund and Balleine, 2007; Rushworth et al., 2007; Behrens et al., 2008; Glascher et al., 2009; Hare et al., 2009). We hypothesized that value information that regulates motivational intensity is evaluated differently in OFC and VMPFC, with OFC neurons emphasizing information about external factors, and VMPFC neurons emphasizing information about internal factors.
We compared the activity of single OFC and VMPFC neurons in behaving monkeys while manipulating external and internal factors controlling the perceived value of task events. We assessed the perceived value of task events by measuring the intensity of two behavioral responses: an operant response (bar release) and an appetitive pavlovian response (lipping) (Bouret and Richmond, 2009). We measured neuronal activity in trials where behavior was guided by visual cues (external factor) or self-initiated (internal factor). We also monitored the influence of satiety, a key internal factor influencing motivation, on behavior and neuronal activity. The neuronal activity in both regions is closely related to the value of task events. The neurons in OFC are more sensitive to external, environment-related information (visual cues), whereas the neurons in VMPFC neurons are more sensitive to internal, subject-related information (self-initiated behavior and satiety).
Materials and Methods
Animals
Two male rhesus monkeys, D (9.5 kg) and T (6.5 kg) were used. The experimental procedures followed the National Institutes of Health Guide for the Care and Use of Laboratory Animals and were approved by the National Institute of Mental Health Animal Care and Use Committee.
Behavior
Each monkey squatted in a primate chair positioned in front of a monitor on which visual stimuli were displayed. A touch-sensitive bar was mounted on the chair at the level of the monkey's hands. Liquid rewards were delivered from a tube positioned with care between the monkey's lips but away from the teeth. With this placement of the reward tube the monkeys did not need to protrude their tongue to receive rewards. The tube was equipped with a force transducer to monitor the movement of the lips (referred to as “lipping” as opposed to licking, which we reserve for the situation in which tongue protrusion is needed) (Bouret and Richmond, 2009). Before each experiment, the amplitude of the signal evoked by delivering of a drop of water through the spout was checked to ensure that it matched the observed lipping response. Monkeys were trained to perform the task depicted in Figure 1.
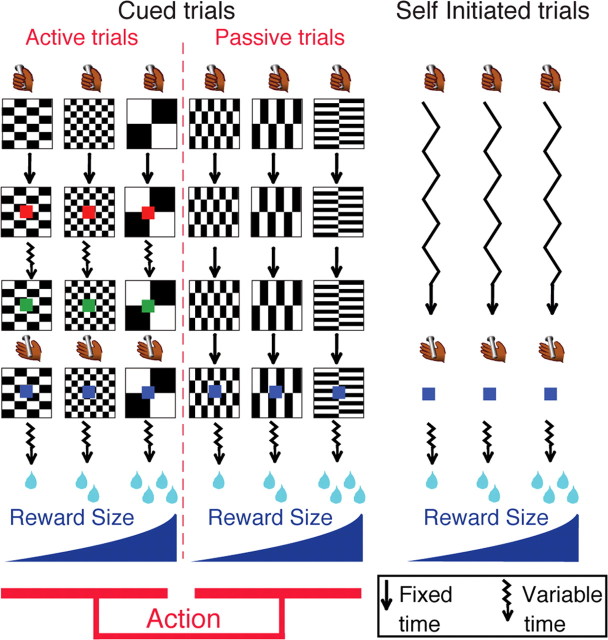
Figure 1.
Experimental design. Monkeys perform three types of trials: cued active (left), cued passive (middle), and self-initiated (right). Every trial starts when the monkey touches a bar. In cued trials, a visual cue (black and white pattern) indicates a combination of two factors: reward size (one, two, or four drops of fluid) and action (active or passive trial). Left, In the cued active trials, monkeys must release the bar when a red spot (wait signal) after a variable time (jagged arrows) turns green (go signal), in which case a feedback (blue spot) appears, followed by the reward. Middle, In cued passive trials, the feedback appears 2 s after cue onset independently of the monkey's behavior. Right, Self-initiated trials simply required touching and releasing a bar; no cue was present. Self-initiated trials were run in randomly alternating blocks of approximately 60 trials with constant reward size (one, two, or four drops).
Cued active trials.
Both monkeys had experience with operant tasks involving a sequential color discrimination task in which they were rewarded for detecting when a target, consisting of a small dot, changed from red to green. Each trial began when the monkey touched the bar. One of three visual cues appeared, followed 500 ms later by a red target (wait signal) in the center of the cue. After a random interval of 500–1500 ms, the target turned green (go signal). If the monkey released the touch bar 200–800 ms after the green target appeared, the target turned blue (feedback signal) and a liquid reward was delivered 400–600 ms later. In cued active trials the reward sizes of one, two, or four drops of liquid were related to the cues. If the monkey released the bar before the go signal appeared or after the go signal disappeared, an error was registered. No explicit punishment was given for an error in either condition, but the monkey had to perform a correct trial to move on in the task. That is, the monkey had to repeat the same trial with a given reward size until the trial was completed correctly. Performance of the operant bar release response was quantified by measuring reaction times and error rates.
Cued passive trials.
Once monkeys adjusted their operant performance as a function of reward-predicting cues (1–2 d), they were exposed to cued passive trials. In these passive trials, monkeys still had to touch the bar to initiate a trial, but once the cue had appeared on the screen, releasing or touching the bar had no effect. Two seconds after cue onset, the blue point also used as a feedback signal in cued active trials was presented and water was delivered 400–600 ms later as a reward. The 2 s delay between cue onset and feedback signal was chosen to match the average interval between these two events in cued active trials. After 2–3 d of training with passive trials alone, monkeys had virtually stopped releasing the bar in cued passive trials. Monkeys were then exposed to a block version of the cued trials for another 2–3 d as follows: blocks of ∼100 trials of each category (cued active or cued passive) alternated without interruption or explicit signaling. In the final version, the six trial types with a combination of reward size (one, two, or four drops) and action contingency (active or passive) alternated randomly. Monkeys were trained for a week in this final version before we started electrophysiological recordings.
Self-initiated trials.
Animals were placed in the same environment as before, except that the background of the screen was changed to a large green rectangle. Monkeys rapidly (1 d) learned to hold and release the bar to get the reward without any conditioned cue signaling reward size or timing of actions. To facilitate comparison with cued trials, a blue point was also used as a feedback signal upon bar release and reward was delivered within 400–600 ms. Before the neurophysiological recordings were taken, monkeys were trained for a week with alternating blocks of different reward sizes (one, two, or four drops). Each block comprised ∼50–70 trials with a given reward size, and blocks alternated randomly and abruptly without explicit signaling.
Satiation procedure.
This procedure was conducted in separate sessions. After a neuron had been isolated for recording and the monkey had completed ∼120–160 cued trials, we interrupted the task and delivered ∼100 cc of water through the spout. We then resumed the task for as long as the monkey would work or for an equivalent number of trials as collected before the “free” water delivery.
Electrophysiology
After initial behavioral training, a magnetic resonance (MR) image at 1.5 T was obtained to determine the placement of the recording well. Then, a sterile surgical procedure was performed under general isoflurane anesthesia in a fully equipped and staffed surgical suite to place the recording well and head fixation post. The well was positioned at the level of the genu of the corpus callosum, with an angle of ∼20° in the coronal plane (Fig. 2).
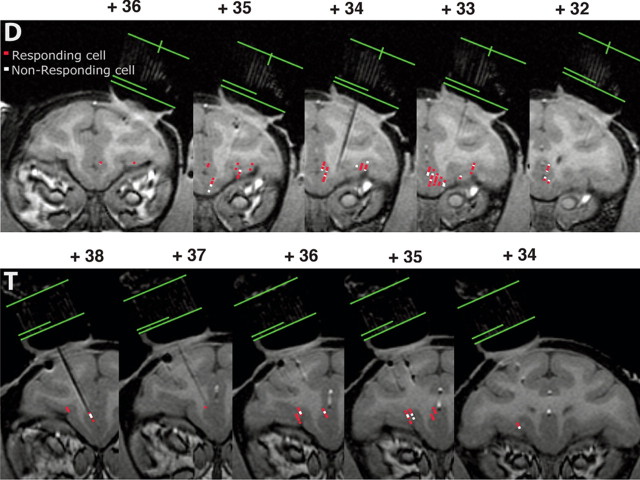
Figure 2.
Localization of recording sites using MRI. Monkeys were scanned with an electrode in place in the grid, and recording sites were identified based on surface position (using the grid), depth measurements, and locations of the electrode on the MR images. Green lines indicate the top, bottom, and center of the grid. Numbers indicate the distance from the interaural line in the rostrocaudal axis. Top, Monkey D; bottom, monkey T; red points, responding neurons; white points, nonresponding neurons. In cases where responding and nonresponding neurons overlap, only nonresponding neurons appear. The distribution of responding and nonresponding neurons in the ventral prefrontal cortex appears homogenous.
Electrophysiological recordings were made with tungsten microelectrodes (FHC or Microprobe; impedance: 1.5 MΩ). The electrode was positioned using a stereotaxic plastic insert with holes 1 mm apart in a rectangular grid (Crist Instruments; 6-YJD-j1). The electrode was inserted through a guide tube. After several recording sessions, MR scans were obtained with the electrode at one of the recording sites; the positions of the recording sites were reconstructed based on relative position in the stereotaxic plastic insert and on the alternation of white and gray matter based on electrophysiological criteria during recording sessions.
Data analysis
Lipping behavior.
The lipping signal was monitored continuously and digitized at 1 kHz (Fig. 3 A). For each trial, the latency of lipping responses after cue appearance and feedback (blue spot) signals was defined as the first of three successive windows in which the signal displayed a consistent increase in voltage of at least 100 mV from a reference epoch of 250 ms taken right before the event of interest (cue or feedback).
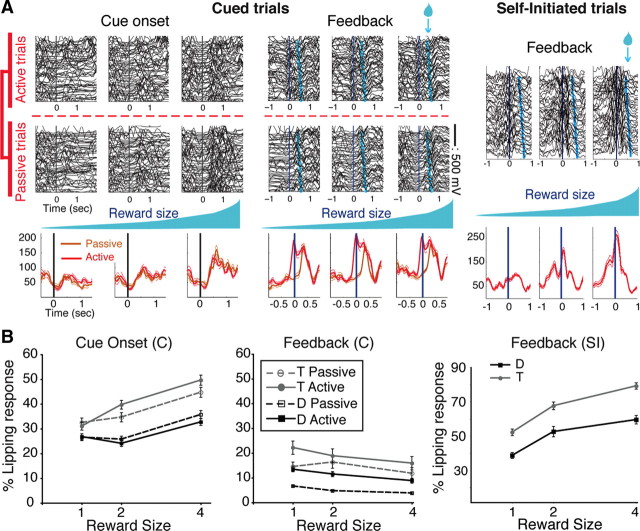
Figure 3.
Lipping behavior. A, Representative examples of lipping behavior. In cued trials, lipping in the six conditions (three reward sizes × active vs Passive) is plotted around cue onset (left) and feedback (middle). Right, Lipping around the feedback in the three conditions (three reward sizes) of the self-initiated trials. Data from cued and self-initiated trials were collected separately. Each line is the signal from one trial. For lipping at the cue, passive trials are sorted by time (first at the top), and active trials are sorted by increasing trial duration. For lipping at the feedback, trials are sorted by increasing time between the feedback (t = 0, vertical line) and reward delivery (light blue symbols). For each reward size condition, average signals for all trials (±SEM) are shown below raw traces. In cued trials, average traces for active (red) and passive (orange) trials are plotted separately. The lipping at the cue increases with reward size, with virtually no difference between active and passive trials. At the feedback, lipping is stronger and begins earlier in cued active than in cued passive trials, with little effect of reward size. In self-initiated trials, lipping around the feedback increases with reward size. B, Percentage of lipping responses across conditions for each monkey (mean ± SEM). Left, In cued trials, the proportion of lipping responses to cues increased with reward size, with no difference between active and passive trials. Middle, At the feedback in cued trials, lipping responses were significantly more frequent in active than in passive trials, with little effect of reward size. Right, In self-initiated trials, the percentage of lipping responses increased for larger rewards.
Single unit activity.
All data analyses were performed in the R statistical computing environment (R Development Core Team 2004). The data were first screened using a sliding window procedure. For each neuron, we counted spikes in a 300 ms test window that was moved in 20 ms increments around the onset of the cue (from −400 to + 1300 ms), around the feedback signal (from −500 to + 1300 ms), and around reward delivery (from −800 to + 1200 ms). At each point, a two-way ANOVA was completed with spike count as the dependent variable. The two factors were reward size (three levels: one, two, four drops) and action (two levels: active, passive). At each time point, we measured the encoding of information about a given factor (percentage of variance explained) for each neuron, as well as the percentage of neurons showing a significant effect (p < 0.05, corrected for multiple comparisons using false discovery rate (“p.adjust” function in R). In self-initiated trials, we used the same approach to study the encoding of reward size around the feedback signal and reward delivery.
Using this screening procedure, we found the epochs that showed a peak in encoding (i.e., variance explained) and focused the analysis on these epochs (n = 5 and 3 in cued and self-initiated trials, respectively; see Result). In each epoch of the cued trials, spike counts were compared across conditions using a two-way ANOVA, with reward size (again, one, two, four drops) and action (active vs passive) as factors. We defined responding neurons as those with a significant effect (p < 0.05) of either factor or their interaction. In self-initiated trials, we used a one-way ANOVA to quantify responses to the reward size factor.
Response latency was defined as the beginning of the first of three successive windows showing a significant effect in the sliding window analysis (p < 0.05). We also measured the time of maximum variance explained after cue onset and around the feedback. It was defined for each neuron as the start time of the window for which the variance explained by a given effect was maximal, whether or not there was a significant response. We considered a 1000 ms cue period starting at cue onset and a 800 ms feedback period centered on the onset of the feedback signal.
To determine the influence of “progression through a session” on neuronal activity, we measured the proportion of responding neurons in each of the five epochs in cued trials (three epochs in self-initiated trials). The means of the proportions of responding neurons across all the epochs of a trial were compared using ANOVA with “brain region” as one factor (two levels: OFC and VMPFC) and progression through a session as another factor (three levels: beginning, middle, and end). Neurons were sorted according to the order in which they were recorded in a session: first (beginning), intermediate (halfway through), and last (last complete recording before the monkey stopped). Neurons that did not belong to any of these three categories were not included in this analysis.
To quantify the effect of the active “satiation” procedure (giving the monkey ∼100 cc of water) on individual neuronal responses, we measured spike counts in epochs where a significant response was detected before the animal was given the bolus of free water. We performed a three-way ANOVA with satiety as the first factor (two levels before and after the bolus delivery), the second being reward size (three levels: one, two, and four drops), and the third being action (active or passive trials). Responses displaying either a main effect of satiety or an interaction between satiety and either of the other two factors were analyzed using a post hoc Tukey honestly significant difference test. The effect of satiation was then classified as “increase” when the encoding of a factor increased, i.e., when a given factor accounted for significantly more variance after than before the satiation, “decrease” when the encoding of a factor decreased, or “change” when the type of response changed, e.g., if the neuron was encoding reward size before and action after the satiation.
Results
Experimental design
The stimulus–reward and action–reward contingencies were manipulated using three different trial types: cued active, cued passive, and self-initiated trials (Fig. 1). In any one trial of each of these trial types, the amount of reward could be one, two, or four drops of fluid. In cued trials, the cue appearing at the beginning of each trial indicated both the amount of fluid reward that would be delivered and whether the trial was active or passive. In cued active trials, the monkeys had to perform an operant bar release response when a red point turned green. A feedback signal (blue point) replaced the green point immediately after each correct response. In cued passive trials, a cue also appeared at the beginning of each trial, and the feedback signal appeared 2 s later, independently of the monkey's behavior (2 s is the average interval between cue and feedback onset in active trials). Cued active and cued passive trials were randomly interleaved during a session. In self-initiated trials the monkeys only had to touch and release a bar; there was no visual cue at the beginning of a trial, but the feedback signal appeared immediately after bar release. Self-initiated trials were presented in randomly alternating blocks, each with a constant reward size (one, two, or four drops). After ∼60 trials, the reward size was changed abruptly. In all trials, cued or self-initiated, the reward was delivered ∼500 ms after the feedback signal.
Behavior
We trained two monkeys (T and D). To measure the value of task events in all task conditions, we monitored a pavlovian appetitive lipping reaction to the cues and the feedback signal (Fig. 3 A). The percentage of trials with lipping responses to cue appearance increased with reward size but was indistinguishable between cued active and cued passive trials (Fig. 3 B, left) [two-way ANOVA: significant effect of reward size factor (monkey D: F (2) = 26, p < 10−10; monkey T: F (2) = 36, p < 10−10); no effect of action factor, cued active vs cued passive (monkey D: F (1) = 1.8, p = 0.2; monkey T: F (1) = 3.5, p = 0.06)]. This indicates that the perceived value of cues depended upon expected reward size and not upon whether an action would be needed to obtain the reward. In contrast, lipping at the feedback was stronger in cued active than in cued passive trials, and there was relatively little effect of the reward size factor (Fig. 3 B, center) [two-way ANOVA: action (monkey D: F (1) = 91, p < 10−10; monkey T: F (1) = 5.6, p = 0.01); reward size (monkey D: F (2) = 11, p = 2 × 10⁻⁵; monkey T: F (2) = 1.9, p = 0.1)]. This indicates that the value of the feedback in cued trials depended much more upon the way in which the trial was completed (active or passive) than on the size of the expected reward. In self-initiated trials, lipping at the feedback increased significantly with reward size (Fig. 3 B, right) (ANOVA for reward size: monkey D: F (2) = 19, p = 4 × 10⁻⁷; T: F (2) = 46, p < 10−10). Thus, in the self-initiated trials where there is no action factor, the value of the feedback is strongly related to reward size.
We also assessed perceived value by monitoring an operant response, bar release (Fig. 4), known to be driven by incentive motivation in similar tasks (Bouret and Richmond, 2009; Minamimoto et al., 2009). In cued active trials, error rates decreased significantly with increasing reward sizes (ANOVA: monkey D: F (2) = 33, p < 10−10; monkey T: F (2) = 8, p = 4 × 10⁻⁴). In cued passive trials, the monkeys virtually never released the bar. In self-initiated trials, release intervals decreased with increasing reward sizes (ANOVA: monkey D: F (2) = 33, p < 10−10; monkey T: F (2) = 8, p = 4 × 10⁻⁴). Thus, the incentive influence of value on operant actions increases with expected reward size in both self-initiated and cued active trials, but not in cued passive trials.
Figure 4.
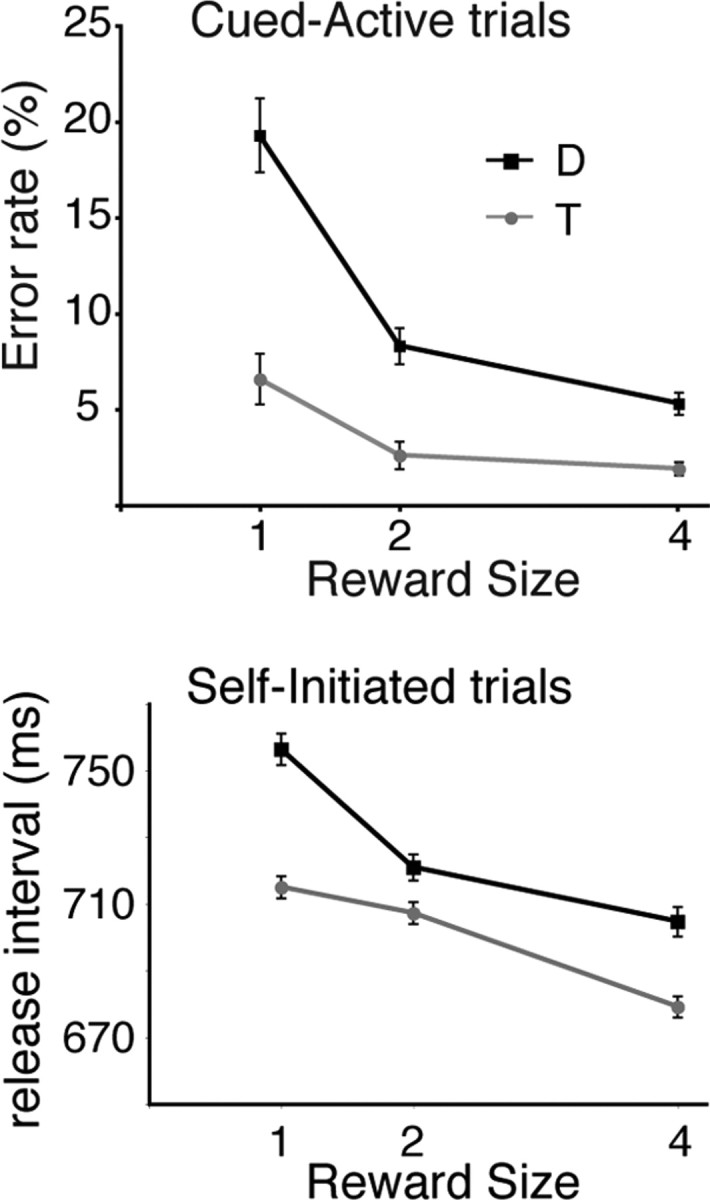
Bar release behavior. Top, In cued trials, error rates were inversely related to reward size. Bottom, In self-initiated trials, the latency to release the bar from the end of the preceding trial (release interval) decreased for larger rewards.
Electrophysiology
We recorded 167 and 188 neurons from the ventral prefrontal cortex of monkey T and D, respectively. All neurons encountered along the track were included in the analysis, as long as the units were well isolated using a time–voltage threshold discrimination criterion. The activity profiles were similar in the two animals, so the neuronal data were pooled. We reconstructed the locations of the neurons using MR imaging (MRI) (Fig. 2). In cued trials, 112 and 121 neurons were recorded from OFC and VMPFC, respectively. In self-initiated trials, 70 and 74 neurons were recorded from OFC and VMPFC, respectively. Based on a visual inspection, neuronal activity in both regions was affected by both the reward size (one, two, or four drops) and the action (passive vs active trials) factors in cued trials (Fig. 5 A–D) and by the reward size factor in self-initiated trials (Fig. 5 E,F). We performed a screening procedure using ANOVA in sliding windows (with a repeated measure correction, see Materials and Methods) to identify epochs with a strong encoding of reward size and/or action. There were five epochs in cued trials (“cue,” from 0 to 450 ms after cue onset; “wait,” from 500 to 950 ms after cue onset; “pre-feedback.,” from 450 to 0 ms before the feedback; “feedback,” from 0 to 450 ms after the feedback; and “reward,” from 0 to 450 ms after reward delivery). There were three epochs in self-initiated trials (pre-feedback, feedback, and reward). In each epoch, we identified responding neurons using a two-way ANOVA (reward size × action) in cued trials and a one-way ANOVA (reward size) in self-initiated trials (see Materials and Methods).
Figure 5.
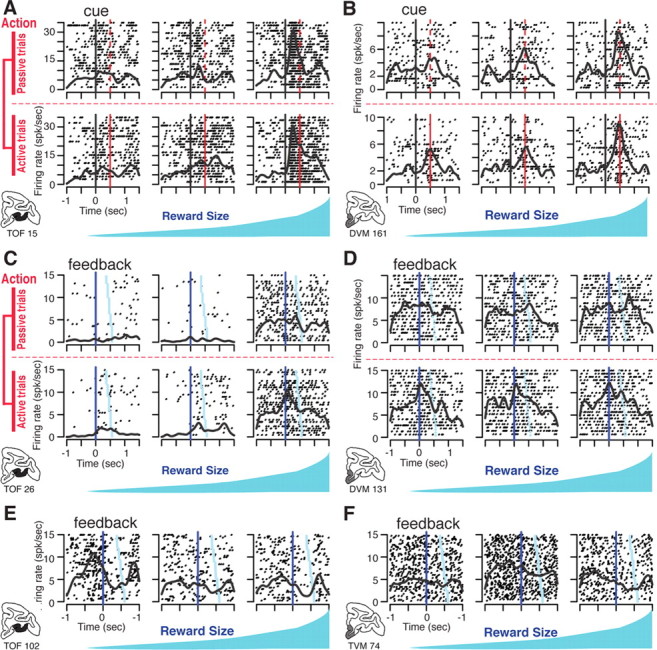
Examples of single unit activity. Each panel (A–F) shows the activity of a different single neuron displayed as rasters (each row of dots shows spike times in one trial) and spike density (continuous black line showing the average firing rate). A, OFC neuron with firing aligned to the time of cue onset (t = 0, black vertical line). The red line indicates the onset of the wait signal in cued active trials (top) and the corresponding time in cued passive trials (bottom). Activity increases with expected reward size. There is no effect of action (no difference between active and passive trials). B, Activity of a VMPFC neuron encoding reward size, but not action. The latency to the response is longer than in the OFC neuron in A. C, OFC neuron with firing aligned on feedback (t = 0) in cued trials. Trials are sorted from top to bottom by increasing interval between feedback and reward delivery (light blue symbols). There is sustained firing in high-reward trials (right), and a transient activation after the feedback in active trials (upper row). D, VMPFC neuron activated at the feedback in cued active trials only. E, OFC neuron activated just before feedback in self-initiated trials with the smallest reward (left). F, VMPFC neuron with a high sustained firing rate during the blocks with intermediate reward in self-initiated trials (center). spk/sec, Spikes per second.
Neurons in OFC and VMPFC encode the perceived value of task events
We inferred that neuronal activity encoding the value of task events should follow the same pattern as the lipping behavior (strong effect of reward size at cue onset, strong effect of action at the feedback in cued trials, and strong effect of reward size in self-initiated trials) (Fig. 3). We compared the effects of reward size and action factors on spike counts for each neuron using two-way ANOVAs in successive 300 ms windows moved in 20 ms steps (sliding window analysis). At cue onset, the encoding of the reward size factor engaged a larger proportion of neurons and accounted for more variance than the encoding of the action factor (Figs. 6, 7, left panels). The encoding of action became more prominent during the course of a trial, with a sharp increase in the proportion of neurons encoding this factor at the feedback (Figs. 6, center panels, 7 C). In self-initiated trials, the information about reward size arises from the structure of the task (block design) rather than from visual stimuli. A large proportion of neurons encoded this factor (Figs. 6, right panels, 7 E). Thus, neuronal activity in both areas followed the same pattern as lipping responses to cues and feedback signals, in line with the idea that neurons in ventral prefrontal cortex encode the value of these events.
Figure 6.
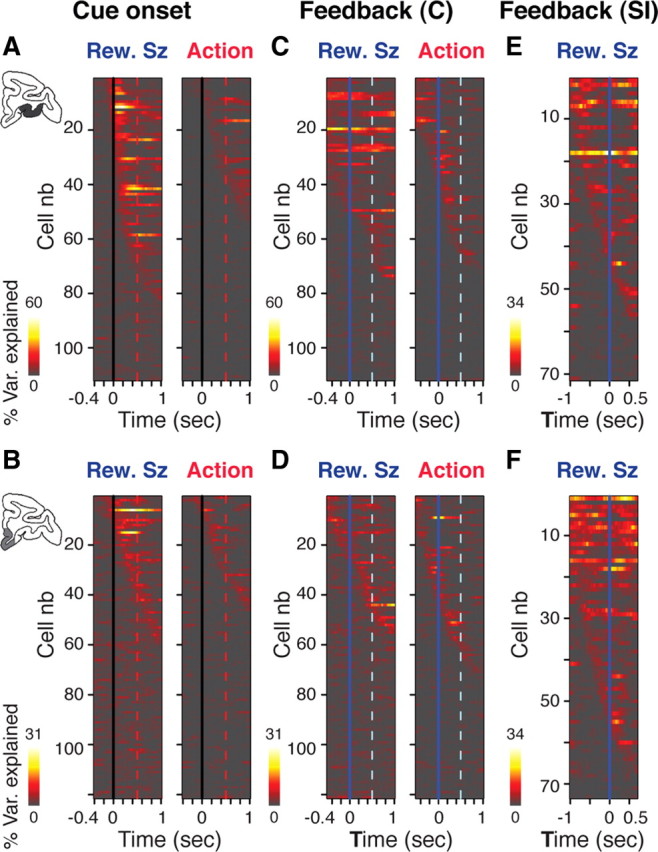
Dynamic encoding of action and reward size in OFC and VMPFC. Sliding window ANOVA analysis for all the neurons in OFC (A, C, E) and VMPFC (B, D, F). In each line the color shows the percentage of variance (% Var.) explained by reward size (Rew.Sz; three levels) or action (two levels) for a single neuron in successive 300 ms windows moved in 20 ms steps. Neurons are sorted from top to bottom according to time of maximum variance. A, B, Activity around cue onset (vertical lines) in OFC (A) and VMPFC (B). Encoding of reward size engages more neurons and is generally earlier than that of action, especially in A (OFC). C, D, Activity around the feedback in cued trials (C) in OFC (C) and VMPFC (D ). Encoding of reward size is stronger that of action in OFC, especially before the feedback. In VMPFC, the encoding of reward size is not as prominent as in OFC. Before the feedback, the encoding of action engages more neurons than that of reward size. E, F, Activity around the feedback in self-initiated trials (SI). The encoding of reward size occurs in both regions. It is stronger in F (VMPFC) than in E (OFC).
Figure 7.
Percentage of responses and mean variance at cue onset and feedback in OFC and VMPFC. Proportion of neurons with a significant response (top) and percentage of variance explained by these significant responses (mean ± SEM, bottom) in sliding window ANOVA. The red vertical dotted line indicates the beginning of the wait period (A, B), and the vertical light blue dotted line indicates the average time of reward delivery (C–F). A, B, Cue onset. A, In OFC, the percentage of neurons encoding reward size (dark blue) increases rapidly. The proportion of neurons encoding action (red) increases through the wait period. More VMPFC neurons are sensitive to reward size (light blue) than to action (orange), but the timing of these two factors is about the same. C, D, Feedback in cued trials. C, In OFC, the proportion of neurons encoding reward size (dark blue line) is stable whereas that of neurons encoding action increases (red line), with the biggest change occurring after feedback. In VMPFC, few neurons encode reward size (light blue). The proportion of neurons encoding action (orange) increases around the time of the feedback. D, The percentage of variance explained by reward size remains higher than that of action in OFC, but not in VMPFC. E, F, Feedback in self-initiated trials. E, A larger proportion of neurons encode reward size in VMPFC (light blue) compared with OFC (dark blue). F, The percentage of variance explained by responding neurons was constant over time and indistinguishable between the two brain areas.
Neuronal activity in these areas was not related to the overt behavior in any simple way that we could identify. We looked for correlation between neuronal activity (firing rates at the cue and around the feedback) and several measures of behavior (reaction time, lipping at the cues, and lipping at the feedback) on a trial-by-trial basis. The number of neurons displaying a significant correlation between firing rate and either reaction time or lipping did not reach significance (i.e., the number of neurons displaying a significant correlation remained lower than the number expected by chance for a sample of this size). Neuronal activity was not related to the physical properties of the stimuli either. In cued trials, eight neurons were tested with two cue sets with which monkeys were equally familiar, and response patterns were indistinguishable between the two cue sets, showing that the responses depended on their associations with the predicted outcomes. Thus, the activity of these neurons is not simply encoding basic motor or sensory processes.
Value-related activity differs between OFC and VMPFC
In cued trials, neurons in both regions were more sensitive to reward size at cue onset and more sensitive to action at the feedback. Nonetheless, response patterns in OFC and VMPFC were different. In OFC, the proportion of neurons encoding reward size was greater than the proportion of neurons encoding action or the interaction between these two factors (Fig. 8 A, top). In VMPFC, the overall proportions of neurons responding to reward size and action were similar, and they were both greater than the proportion of neurons encoding the interaction between the two factors (Fig. 8 A, bottom). In addition, the encoding of the action factor around the feedback differed between OFC and VMPFC. In VMPFC the increase in proportion of neurons encoding action occurred before the feedback (Fig. 8 A, bottom), whereas in OFC the encoding of action peaked after the feedback (Fig. 8 A, top). In self-initiated trials, the encoding of reward size was indistinguishable across the three epochs (χ2 p > 0.05) (Fig. 8 B).
Figure 8.
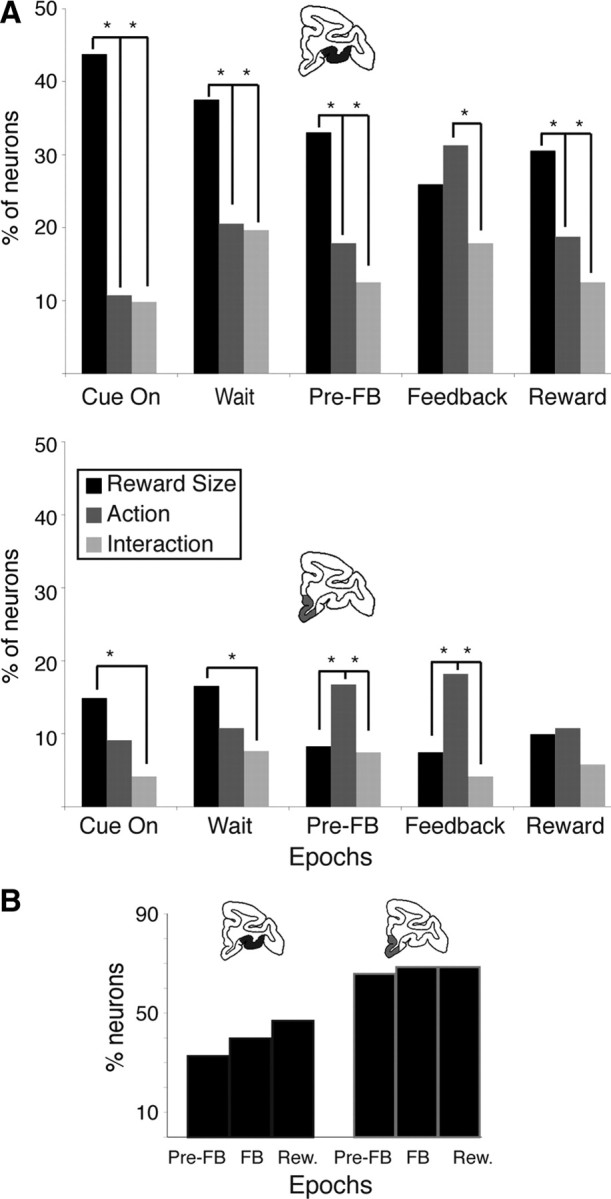
Proportion of responding neurons across epochs of a trial. A, Cued trials. Proportion of neurons responding to reward size (black), action (passive vs active; dark gray), and their interaction (light gray) in each of the five epochs in OFC (top) and VMPFC (bottom); *p < 0.05, significant difference in proportion (χ2). More OFC (top) than VMPFC (bottom) neurons respond overall. In OFC (top), neurons predominantly encode reward size except between the feedback (FB) and reward (Rew.) delivery, where the encoding of action peaked. Indeed, the proportion of neurons encoding action after the feedback was greater than in all the other epochs (χ2, p < 0.05). In VMPFC more neurons encode action than reward size both before and after the feedback. B, Self-initiated trials. Percentage of neurons encoding reward size in each of the three epochs in VMPFC (left) and OFC (right). Conventions are as in A. In this case, the percentage of responsive neurons was larger in VMPFC. The proportions of responding neurons were indistinguishable across the three epochs in both OFC and VMPFC.
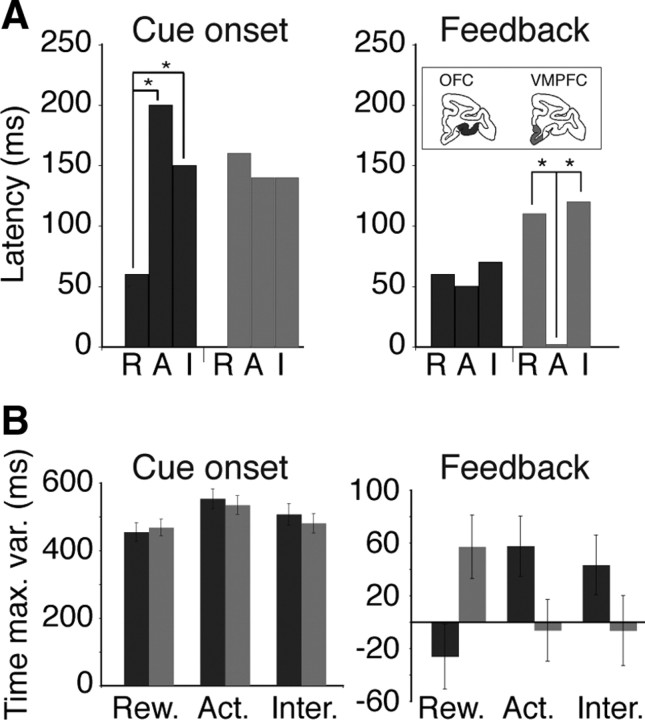
We also examined the timing of responses to the cues and the feedback signal in cued trials by measuring response latencies (when the encoding of an effect started) (Fig. 9 A) and the time of maximum variance explained (when the encoding of an effect peaked) (Fig. 9 B). At cue onset, the median response latency for reward size was significantly shorter in OFC [median = 60 ms, interquartile range (IQR) = 0–140 ms] than in VMPFC (median = 160 ms, IQR = 40–260 ms; Wilcoxon test: p = 0.04) (Fig. 9 A, left). The time at which selectivity peaked (time of maximum variance explained) was shorter for the reward size than for the action factor, but there was no difference between the two regions (Fig. 9 B, left). Thus, at the cue, the encoding of reward size began earlier in OFC than in VMPFC, but the time at which the effect peaked was indistinguishable between the two areas. At the feedback, response latencies for reward size, action, or their interaction were indistinguishable in OFC. In VMPFC, response latencies to action were significantly shorter than responses to reward size or to the interaction between these two factors (Fig. 9 A, right). In addition, in VMPFC the encoding of action (percentage of variance explained) peaked earlier (at the feedback) than the encoding of reward size (after the feedback), whereas in OFC the encoding of reward size peaked before that of action (Fig. 9 B, right).
Figure 9.
Latencies of responses to action, reward size, and their interaction. A, Median latency of responses to the factors reward size (R), action (A), and their interaction (I) in OFC (black) and VMPFC (gray). At cue onset, OFC neurons started to encode reward size significantly earlier than action and interaction (Wilcoxon test: p < 0.05). In VMPFC, latencies of the three effects were indistinguishable. At the feedback signal, VMPFC neurons started to encode action significantly earlier than reward size and interaction (Wilcoxon test: p < 0.05). In OFC, latencies of the three effects were indistinguishable. B, Time of maximum variance explained after cue onset (left) or around the feedback (right). The time of maximum variance explained of all neurons was analyzed using a two-way ANOVA with “type of effect” (three levels) and region (two levels) as factors. At cue onset, there was a significant effect of type of effect (F (2) = 4.3, p = 0.01) but no effect of region and no interaction (F < 0.5, p > 0.5). Neurons showed a maximum sensitivity to reward (Rew.) size before the effect of the action (Act.) factor peaked (Tukey test, p = 0.01). Around the feedback, there was no effect of type of effect or region factors (F < 0.5, p > 0.5), but their interaction (Inter.) was significant (F (2,690) = 6.5, p = 0.001). In VMPFC, the encoding of action peaked earlier than the encoding of reward size, whereas in OFC the encoding of reward size peaked before that of action.
In short, at cue onset the encoding of reward size is more prominent and arises earlier in OFC than in VMPFC. At the feedback in cued trials, neurons become more sensitive to the action factor and the transition begins earlier in VMPFC (before the feedback) than in OFC (after the feedback signal).
Ventral prefrontal neurons do not encode the incentive influence of value on operant actions
We reasoned that to encode the incentive influence of value on operant actions, i.e., the amount of energy invested in goal-directed behavior, neuronal activity should follow the same pattern as the bar release responses. That is, firing should be affected by reward size in cued active but not in cued passive trials. We searched neurons displaying that specific pattern among neurons displaying a significant interaction between reward size and action. Less than 5% of all the neurons showed this specific pattern across the five epochs of a trial (means: 2.8 ± 1% in OFC and 1.4 ± 1% in VMPFC). Thus, the activity of ventral prefrontal neurons does not reflect the incentive effect of event value on operant actions.
Differential influence of internal and external factors on OFC and VMPFC activity
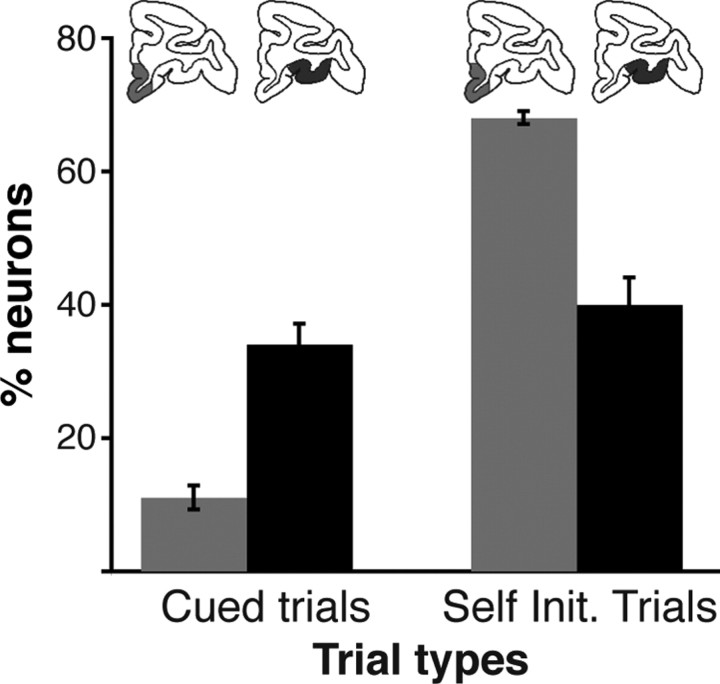
To assess the relative influence of information about external and internal factors, we compared neuronal activity between cued and self-initiated trials. We reasoned that in cued trials the value of events was determined mostly based on external information (visual stimuli), whereas in self-initiated trials value depended more upon internal knowledge. A direct comparison between the two regions showed that the reward size factor was predominantly encoded in VMPFC neurons during self-initiated trials and predominantly encoded in OFC during cued trials (Fig. 10) (two-way ANOVA on percentages of neurons encoding the factor reward size; significant effect of region: F (1) = 116, p = 1.6 × 10⁻⁷; no effect of trial type: F (1) = 2, p = 0.2; and significant interaction: F (1,12) = 77, p = 1.5 × 10⁻⁶). Thus, VMPFC neurons are more heavily involved when monkeys spontaneously engage in reward-directed behavior, whereas OFC neurons are more heavily involved when motivational value relies on information provided by visual stimuli.
Figure 10.
Encoding of reward size across trial types and brain regions. Percentage of neurons encoding reward size in cued trials (means and SEM across five epochs) and self-initiated trials (means and SEM across three epochs). There was a significant effect of region (two-way ANOVA, F (1) = 116, p = 1.6 × 10⁻⁷), no effect of trial type (F (1) = 2, p = 0.2), and a significant interaction (F (1,12) = 77, p = 1.5 × 10⁻⁶). The proportion of neurons encoding reward size was higher in OFC than in VMPFC in cued trials, and the proportion of neurons encoding reward size in OFC was indistinguishable between the two trial types. In the self-initiated (Self Init.) trials, the proportion of neurons encoding reward size in VMPFC was higher than that in OFC or VMPFC in the cued trials.
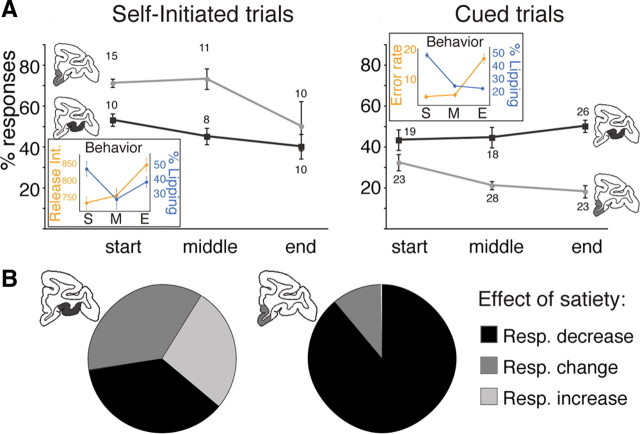
To assess the influence of satiety, a critical internal factor affecting motivational values, we examined changes in behavior and neuronal activity as monkeys accumulated water during the course of a session (Minamimoto et al., 2009). Monkeys displayed a progressive decrease in lipping responses and bar release performance as they progressed through a session (Fig. 11 A, insets), showing that the value of task events decreases as monkeys accumulate water. In self-initiated trials, in both VMPFC and in OFC the proportion of selective neurons (i.e., showing a significant discrimination) decreased over the course of a session (Fig. 11 A, left) (two-way ANOVA; significant effect of progression: F (2) = 4.5, p = 0.03; significant effect of region: F (1) = 13, p = 3.5 × 10⁻³; and no interaction: F (2,12) = 0.9, p = 0.4). In cued trials, the proportion of selective neurons decreased in VMPFC but not in OFC, where the proportions of selective neurons across the three periods of a session were indistinguishable (Fig. 11 A, right) (two-way ANOVA; no main effect of progression: F (2) = 0.8, p = 0.4; significant effect of regions: F (1) = 54, p = 1.4 × 10⁻⁷; and significant interaction: F (2,24) = 3.5, p = 0.04). To examine whether the decreases could be at least partly due to satiety (fatigue would be another obvious contributor to this effect), we recorded another set of neurons (n = 14 and 12 in VMPFC and OFC, respectively) while the monkeys were given a large bolus of water (∼50% of their usual daily intake) early in the session (before they had completed 200 trials). There was an immediate, significant decrease in performance (average error rate increased from 1.8 ± 0.4% to 13 ± 2%; t(1) = 5.3, p = 2 × 10⁻⁶). There was also a significant decrease in selectivity (i.e., in the amount of variance explained by reward size and action factors or their interaction; three-way ANOVA) for 8/9 selective VMPFC neurons, whereas the proportion of responding neurons was unchanged in OFC (Fig. 11 B). This confirms that the effects observed during the course of a session could at least in part be due to satiety. Thus, VMPFC responses appear to depend upon the amount of fluid received up to the time of the recording. In OFC, the proportion of selective neurons was affected by satiety in self-initiated trials, but not in cued-trials, suggesting that when an external stimulus is present its influence is powerful enough to mask any effect related to an internal factor.
Figure 11.
Response modulation with progression in a session and satiety. A, Mean percentages (±SEM) of responses for neurons recorded at the very beginning (start), halfway through (middle), and at the end (end) of a recording session. Numbers indicate number of neurons at each point. Insets, Corresponding behavioral performances (mean and SEM). Monkeys showed a decrease in lipping (blue) and bar release responses (orange) as they progressed through a session (ANOVA, p < 0.05). In self-initiated trials, the proportion of selective neurons decreased in both areas. In cued trials, there was a significant decrease in the proportion of selective neurons in VMPFC, but not in OFC. S, Start; M, middle; E, end. B, Effect of satiety on neuronal responses (Resp.). Neurons in VMPFC (n = 14) and OFC (n = 12) were recorded while monkeys performed the cued trials before and after receiving a large bolus of water early in the session. In VMPFC, eight of nine selective neurons showed a decrease in response. For seven of these, the response disappeared completely. In OFC, an equivalent number of selective neurons (n = 11) showed a decrease, an increase, or a change in response pattern (n = 4, 3, and 4, respectively). The response disappeared for three of four neurons showing a decrease.
Discussion
Neuronal activity in both OFC and VMPFC is closely related to the perceived value of task events. OFC neurons emphasize value information arising from visual stimuli, whereas VMPFC neurons emphasize value information arising from intrinsic knowledge or satiety levels. The differences in neuronal activity between OFC and VMPFC provide physiological support for the hypothesis, originally based on anatomy, that OFC and VMPFC play different roles in calculating motivational values.
Our data are compatible with previous reports in monkeys and rats showing that OFC neurons are very sensitive to the value of sensory cues, with little influence of the type of operant response animals must perform to get the reward (Schoenbaum et al., 1998; Tremblay and Schultz, 2000; Roesch and Olson, 2004; Padoa-Schioppa and Assad, 2006; Wallis, 2007; Kennerley and Wallis, 2009). This is in line with anatomical data showing strong interactions between OFC and sensory cortices (Ongur and Price, 2000). After the feedback, OFC neurons became more sensitive to the action factor (cued active vs passive trials), in line with a recent report showing that OFC neurons encode the behavioral response at the time of the feedback (Tsujimoto et al., 2009). Here, we show that OFC neurons encode information about the perceived value of both cues and feedback signals, measured using a pavlovian response. This procedure also revealed that the OFC neurons encode the value of task events in a nonchoice situation, even when no movement (or absence of movement) is explicitly required to obtain the reward.
VMPFC neurons are significantly less involved in externally driven motivational processes but heavily engaged when value information arises from internal factors such as spontaneous initiation of actions and thirst. This is in line with anatomical data showing strong interactions between VMPFC, limbic areas. and brainstem nuclei involved in autonomic regulation (Ongur and Price, 2000). These data are consistent with functional imaging studies showing that in humans blood oxygenation level-dependent signals in VMPFC correlate with the feeling of thirst, subjective decision value, or “self-relatedness” (Gusnard et al., 2001; de Araujo et al., 2003; Egan et al., 2003; Kable and Glimcher, 2007; Valentin et al., 2007; Behrens et al., 2008; Northoff and Panksepp, 2008; Glascher et al., 2009; Hare et al., 2009). This is also compatible with earlier experiments showing that electrical stimulation of the VMPFC can elicit drinking in sated monkeys (Robinson and Mishkin, 1968).
The value of cues arises mainly from their association with different reward sizes (Cardinal et al., 2002; Berridge, 2004). In line with the idea that OFC neurons are more sensitive to external information about event value, the encoding of reward size is stronger and appears earlier in OFC than in VMPFC. The value of the feedback signal depends much more upon the action factor, i.e., upon whether completing the trial required a bar release. This effect could be mediated by inputs from structures controlling the action and/or structures monitoring the movement. In any case, the event defined by the appearance of the feedback signal is more valuable to the animal when it follows an operant response. In line with the idea that VMPFC neurons are more sensitive to internal information about event value, the encoding of the action factor increased earlier in VMPFC (at the feedback) than in OFC (after the feedback).
In contrast to measuring the value of task events and their associated outcomes as is often done using choice paradigms (Tremblay and Schultz, 2000; Padoa-Schioppa and Assad, 2006; Kable and Glimcher, 2007; Glascher et al., 2009; Kennerley and Wallis, 2009), here we measure the perceived value of task events using the intensity of an operant bar release and a pavlovian lipping response. The comparison of these responses in passive and active trials allowed us to distinguish activity related to the value of events in all conditions (measured using lipping) from activity more specifically related to operant, goal-directed behavior (Balleine and Dickinson, 1998; Cardinal et al., 2002; Berridge, 2004; Berridge and Kringelbach, 2008; Minamimoto et al., 2009). Although we cannot ask animals about the subjective aspects of these processes, pavlovian conditioning is widely used as a reflection of emotional processes in animals (Cardinal et al., 2002; Berridge, 2004; Berridge and Kringelbach, 2008; Bouret and Richmond, 2009). It is reasonable to think that lipping occurs when an event has a positive (hedonic) affective value. The lipping patterns that we observed are consistent with this interpretation. Neuronal activity in both OFC and VMPFC was closely related to the pattern of lipping responses, but firing did not merely encode motor aspects of lipping. Thus, these data support the idea that the neuronal responses in these two regions of the ventral prefrontal cortex are related to the hedonic value of task events (Cardinal et al., 2002; Kringelbach et al., 2003; Cox et al., 2005; Kable and Glimcher, 2007; Behrens et al., 2008; Berridge and Kringelbach, 2008).
These two areas, OFC and VMPFC, are thought to be involved in assessing information about outcome values during decision processes (Damasio, 1994; Izquierdo et al., 2004; Rushworth et al., 2007; Wallis, 2007). However, our data indicate that relatively few neurons directly encode the incentive influence of the reward on the operant bar release response. In other words, ventral prefrontal neurons do not seem to carry information directly relevant to the modulation of goal-directed actions as a function of the expected reward value. The roles that ventral prefrontal areas play in operant aspects of motivation and decision-making could be exerted via their projections to other structures such as ventral striatum, ventral pallidum, premotor cortex, or anterior cingulate cortex, where information about value would be integrated with motor information to drive reward-directed actions (Shidara and Richmond, 2002; Matsumoto et al., 2003; Amiez et al., 2006; Kennerley and Wallis, 2009).
We propose that OFC and VMPFC have different roles in motivation: they both seem sensitive to the perceived value of events, with VMPFC critical for subject-centered, internally driven motivational processes, whereas OFC is critical for environment-centered, externally driven motivational processes.
Footnotes
This work was supported by the Intramural Research Program of the National Institute of Mental Health. We are grateful to Janine Simmons, Andrew Clark, John Wittig Jr, Narihisa Matsumoto, Walter Lerchner, and Mortimer Mishkin for their helpful comments on this work.
References
- Amiez C, Joseph JP, Procyk E. Reward encoding in the monkey anterior cingulate cortex. Cereb Cortex. 2006;16:1040–1055. doi: 10.1093/cercor/bhj046. [DOI] [PMC free article] [PubMed] [Google Scholar]
- Balleine BW, Dickinson A. Goal-directed instrumental action: contingency and incentive learning and their cortical substrates. Neuropharmacology. 1998;37:407–419. doi: 10.1016/s0028-3908(98)00033-1. [DOI] [PubMed] [Google Scholar]
- Behrens TE, Hunt LT, Woolrich MW, Rushworth MF. Associative learning of social value. Nature. 2008;456:245–249. doi: 10.1038/nature07538. [DOI] [PMC free article] [PubMed] [Google Scholar]
- Berridge KC. Motivation concepts in behavioral neuroscience. Physiol Behav. 2004;81:179–209. doi: 10.1016/j.physbeh.2004.02.004. [DOI] [PubMed] [Google Scholar]
- Berridge KC, Kringelbach ML. Affective neuroscience of pleasure: reward in humans and animals. Psychopharmacology (Berl) 2008;199:457–480. doi: 10.1007/s00213-008-1099-6. [DOI] [PMC free article] [PubMed] [Google Scholar]
- Bouret S, Richmond BJ. Relation of locus coeruleus neurons in monkeys to pavlovian and operant behaviors. J Neurophysiol. 2009;101:898–911. doi: 10.1152/jn.91048.2008. [DOI] [PMC free article] [PubMed] [Google Scholar]
- Cardinal RN, Parkinson JA, Hall J, Everitt BJ. Emotion and motivation: the role of the amygdala, ventral striatum, and prefrontal cortex. Neurosci Biobehav Rev. 2002;26:321–352. doi: 10.1016/s0149-7634(02)00007-6. [DOI] [PubMed] [Google Scholar]
- Cox SM, Andrade A, Johnsrude IS. Learning to like: a role for human orbitofrontal cortex in conditioned reward. J Neurosci. 2005;25:2733–2740. doi: 10.1523/JNEUROSCI.3360-04.2005. [DOI] [PMC free article] [PubMed] [Google Scholar]
- Damasio AR. Descartes' error: emotion, reason, and the human brain. New York: Putnam; 1994. [Google Scholar]
- de Araujo IE, Kringelbach ML, Rolls ET, McGlone F. Human cortical responses to water in the mouth, and the effects of thirst. J Neurophysiol. 2003;90:1865–1876. doi: 10.1152/jn.00297.2003. [DOI] [PubMed] [Google Scholar]
- Egan G, Silk T, Zamarripa F, Williams J, Federico P, Cunnington R, Carabott L, Blair-West J, Shade R, McKinley M, Farrell M, Lancaster J, Jackson G, Fox P, Denton D. Neural correlates of the emergence of consciousness of thirst. Proc Natl Acad Sci U S A. 2003;100:15241–15246. doi: 10.1073/pnas.2136650100. [DOI] [PMC free article] [PubMed] [Google Scholar]
- Glascher J, Hampton AN, O'Doherty JP. Determining a role for ventromedial prefrontal cortex in encoding action-based value signals during reward-related decision making. Cereb Cortex. 2009;19:483–495. doi: 10.1093/cercor/bhn098. [DOI] [PMC free article] [PubMed] [Google Scholar]
- Gottfried JA, O'Doherty J, Dolan RJ. Encoding predictive reward value in human amygdala and orbitofrontal cortex. Science. 2003;301:1104–1107. doi: 10.1126/science.1087919. [DOI] [PubMed] [Google Scholar]
- Gusnard DA, Akbudak E, Shulman GL, Raichle ME. Medial prefrontal cortex and self-referential mental activity: relation to a default mode of brain function. Proc Natl Acad Sci U S A. 2001;98:4259–4264. doi: 10.1073/pnas.071043098. [DOI] [PMC free article] [PubMed] [Google Scholar]
- Hare TA, Camerer CF, Rangel A. Self-control in decision-making involves modulation of the vmPFC valuation system. Science. 2009;324:646–648. doi: 10.1126/science.1168450. [DOI] [PubMed] [Google Scholar]
- Izquierdo A, Suda RK, Murray EA. Bilateral orbital prefrontal cortex lesions in rhesus monkeys disrupt choices guided by both reward value and reward contingency. J Neurosci. 2004;24:7540–7548. doi: 10.1523/JNEUROSCI.1921-04.2004. [DOI] [PMC free article] [PubMed] [Google Scholar]
- Kable JW, Glimcher PW. The neural correlates of subjective value during intertemporal choice. Nat Neurosci. 2007;10:1625–1633. doi: 10.1038/nn2007. [DOI] [PMC free article] [PubMed] [Google Scholar]
- Kennerley SW, Wallis JD. Evaluating choices by single neurons in the frontal lobe: outcome value encoded across multiple decision variables. Eur J Neurosci. 2009;29:2061–2073. doi: 10.1111/j.1460-9568.2009.06743.x. [DOI] [PMC free article] [PubMed] [Google Scholar]
- Kringelbach ML, O'Doherty J, Rolls ET, Andrews C. Activation of the human orbitofrontal cortex to a liquid food stimulus is correlated with its subjective pleasantness. Cereb Cortex. 2003;13:1064–1071. doi: 10.1093/cercor/13.10.1064. [DOI] [PubMed] [Google Scholar]
- Matsumoto K, Suzuki W, Tanaka K. Neuronal correlates of goal-based motor selection in the prefrontal cortex. Science. 2003;301:229–232. doi: 10.1126/science.1084204. [DOI] [PubMed] [Google Scholar]
- Minamimoto T, La Camera G, Richmond BJ. Measuring and modeling the interaction among reward size, delay to reward, and satiation level on motivation in monkeys. J Neurophysiol. 2009;101:437–447. doi: 10.1152/jn.90959.2008. [DOI] [PMC free article] [PubMed] [Google Scholar]
- Northoff G, Panksepp J. The trans-species concept of self and the subcortical-cortical midline system. Trends Cogn Sci. 2008;12:259–264. doi: 10.1016/j.tics.2008.04.007. [DOI] [PubMed] [Google Scholar]
- Ongur D, Price JL. The organization of networks within the orbital and medial prefrontal cortex of rats, monkeys and humans. Cereb Cortex. 2000;10:206–219. doi: 10.1093/cercor/10.3.206. [DOI] [PubMed] [Google Scholar]
- Ostlund SB, Balleine BW. The contribution of orbitofrontal cortex to action selection. Ann N Y Acad Sci. 2007;1121:174–192. doi: 10.1196/annals.1401.033. [DOI] [PubMed] [Google Scholar]
- Padoa-Schioppa C, Assad JA. Neurons in the orbitofrontal cortex encode economic value. Nature. 2006;441:223–226. doi: 10.1038/nature04676. [DOI] [PMC free article] [PubMed] [Google Scholar]
- Ressler KJ, Mayberg HS. Targeting abnormal neural circuits in mood and anxiety disorders: from the laboratory to the clinic. Nat Neurosci. 2007;10:1116–1124. doi: 10.1038/nn1944. [DOI] [PMC free article] [PubMed] [Google Scholar]
- Robinson BW, Mishkin M. Alimentary responses to forebrain stimulation in monkeys. Exp Brain Res. 1968;4:330–366. doi: 10.1007/BF00235700. [DOI] [PubMed] [Google Scholar]
- Roesch MR, Olson CR. Neuronal activity related to reward value and motivation in primate frontal cortex. Science. 2004;304:307–310. doi: 10.1126/science.1093223. [DOI] [PubMed] [Google Scholar]
- Rushworth MF, Behrens TE, Rudebeck PH, Walton ME. Contrasting roles for cingulate and orbitofrontal cortex in decisions and social behaviour. Trends Cogn Sci. 2007;11:168–176. doi: 10.1016/j.tics.2007.01.004. [DOI] [PubMed] [Google Scholar]
- Schoenbaum G, Chiba AA, Gallagher M. Orbitofrontal cortex and basolateral amygdala encode expected outcomes during learning. Nat Neurosci. 1998;1:155–159. doi: 10.1038/407. [DOI] [PubMed] [Google Scholar]
- Shidara M, Richmond BJ. Anterior cingulate: single neuronal signals related to degree of reward expectancy. Science. 2002;296:1709–1711. doi: 10.1126/science.1069504. [DOI] [PubMed] [Google Scholar]
- Tremblay L, Schultz W. Reward-related neuronal activity during go-nogo task performance in primate orbitofrontal cortex. J Neurophysiol. 2000;83:1864–1876. doi: 10.1152/jn.2000.83.4.1864. [DOI] [PubMed] [Google Scholar]
- Tsujimoto S, Genovesio A, Wise SP. Monkey orbitofrontal cortex encodes response choices near feedback time. J Neurosci. 2009;29:2569–2574. doi: 10.1523/JNEUROSCI.5777-08.2009. [DOI] [PMC free article] [PubMed] [Google Scholar]
- Valentin VV, Dickinson A, O'Doherty JP. Determining the neural substrates of goal-directed learning in the human brain. J Neurosci. 2007;27:4019–4026. doi: 10.1523/JNEUROSCI.0564-07.2007. [DOI] [PMC free article] [PubMed] [Google Scholar]
- Wallis JD. Orbitofrontal cortex and its contribution to decision-making. Annu Rev Neurosci. 2007;30:31–56. doi: 10.1146/annurev.neuro.30.051606.094334. [DOI] [PubMed] [Google Scholar]


