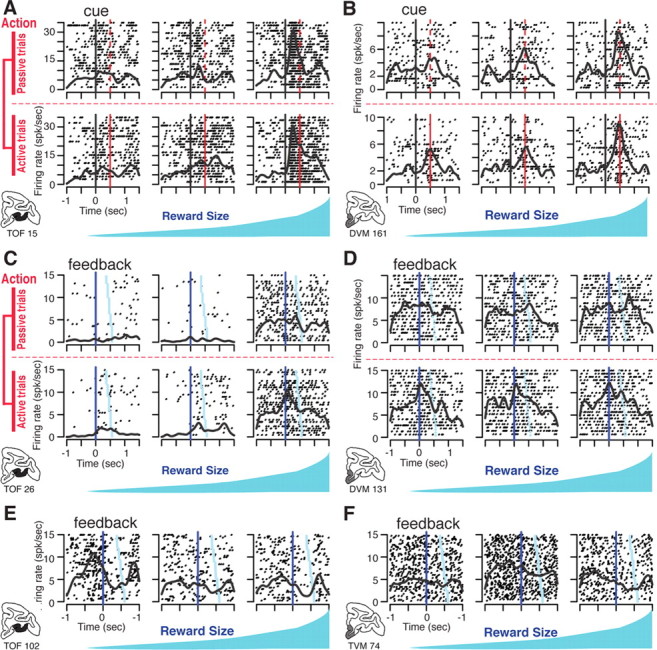
Figure 5.

Examples of single unit activity. Each panel (A–F) shows the activity of a different single neuron displayed as rasters (each row of dots shows spike times in one trial) and spike density (continuous black line showing the average firing rate). A, OFC neuron with firing aligned to the time of cue onset (t = 0, black vertical line). The red line indicates the onset of the wait signal in cued active trials (top) and the corresponding time in cued passive trials (bottom). Activity increases with expected reward size. There is no effect of action (no difference between active and passive trials). B, Activity of a VMPFC neuron encoding reward size, but not action. The latency to the response is longer than in the OFC neuron in A. C, OFC neuron with firing aligned on feedback (t = 0) in cued trials. Trials are sorted from top to bottom by increasing interval between feedback and reward delivery (light blue symbols). There is sustained firing in high-reward trials (right), and a transient activation after the feedback in active trials (upper row). D, VMPFC neuron activated at the feedback in cued active trials only. E, OFC neuron activated just before feedback in self-initiated trials with the smallest reward (left). F, VMPFC neuron with a high sustained firing rate during the blocks with intermediate reward in self-initiated trials (center). spk/sec, Spikes per second.
