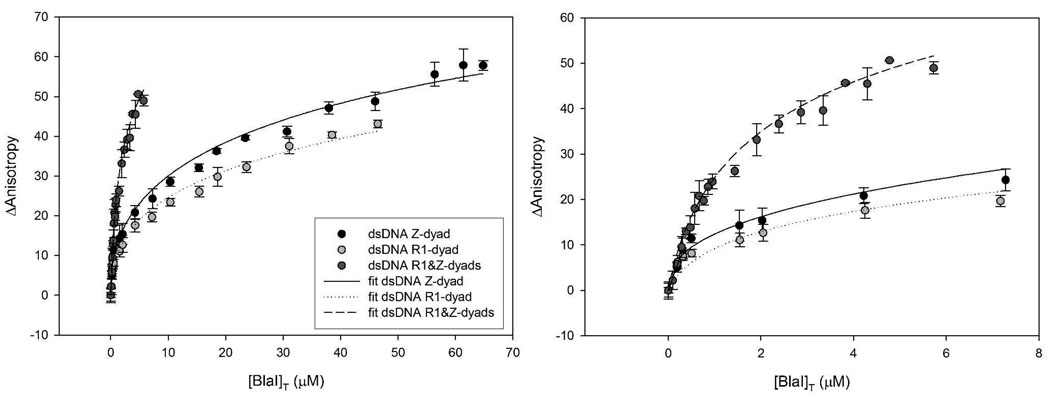
Figure 2.
Fluorescence anisotropy measurement of BlaI binding to DNA. The lines show the corresponding fits to the model shown in Scheme 1, where the equilibrium between BlaI monomer and dimer is characterized by Kd. The equations used are described in Supporting Information. The panel on the right is the same as the image on the left panel, except that the plot is given for a more narrow concentration range.

