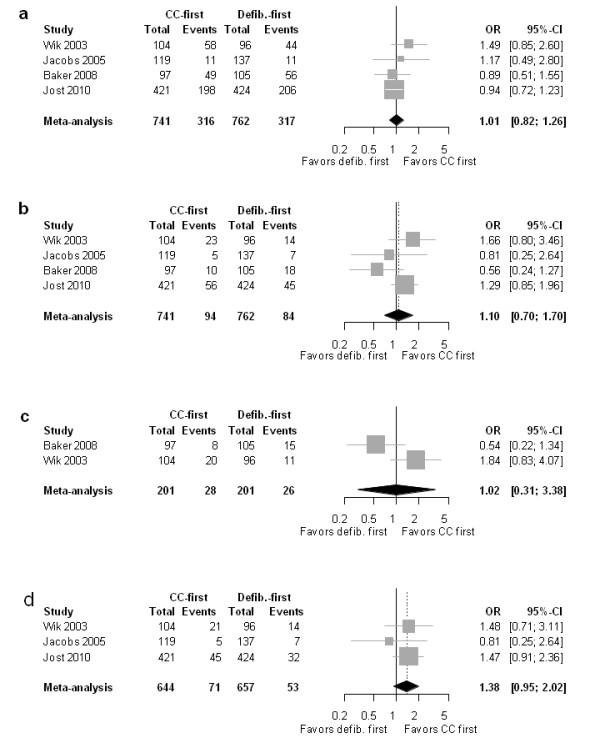
Figure 2.

Forest plot of odds ratios (OR) of (a) ROSC, (b) survival to hospital discharge (primary endpoint), (c) favorable neurologic outcome, and (d) 1-year survival. Horizontal bars indicate 95% confidence intervals. Size of markers represents study weight in meta-analysis.
