Fig. 5.

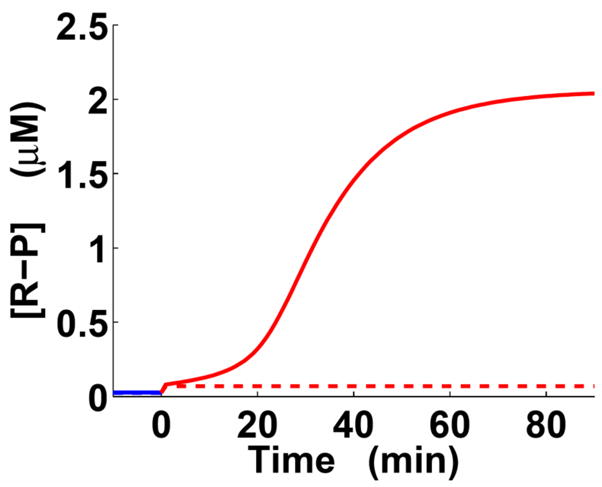
Positive feedback impacts expression output before a system reaches steady state (Fig. 1c; Eqs. (3)–(4)). Blue and red lines correspond to low and high stimulus, respectively. Solid lines – positive feedback present; dashed lines – positive feedback absent. The state of the system before and at time 0 is the steady state determined for the nominal parameter set. At time 0, the system was activated by an instantaneous 5-fold increase in the regulator phosphorylation rate (ka).
