
Figure 3.
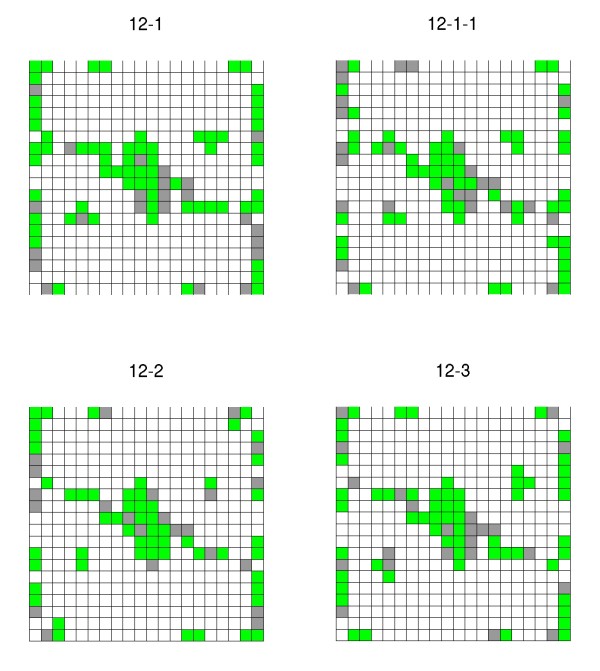
3-colors maps example. Figure 3: 3-colors maps activation for the tomato chromosome 12 (ILs 12-1-1, 12-1, 12-2 and 12-3). In gray: mean transcripts and/or metabolites which are below 1 standard deviation out of the neuron mean. In green: mean transcripts and/or metabolites which are above 1 standard deviation out of the neuron mean. In other cases, the neurons are painted white.